

NCERT Solutions for Class 8 Maths Part 2 Chapter 5 - Tales by Dots and Lines
Class 8 Maths Part 2 Chapter 5 Tales by Dots and Lines helps students understand the interesting world of data handling and its representation. Students understand data handling and its representation with the help of the activities given in this chapter. Students get to learn how to organise, visualise, and interpret data with the help of charts and averages from this chapter. These latest NCERT Solutions for Class 8 Maths based on the latest textbook are comprehensive and in simple language so that all types of students can understand them and do them on their own from next time.
This Story also Contains
- Class 8 Maths Part 2 Chapter 5 Solutions PDF Free Download - Ganita Prakash Book 2
- NCERT Solutions for Class 8 Maths Ganita Prakash Part 2 Chapter 5 Exercise Questions and Answers
- Key Concepts Explained in Tales by Dots and Lines - Ganita Prakash Book 2
- Extra Questions for Class 8 Maths Part 2 Chapter 5 Tales by Dots and Lines
- NCERT Solutions for Class 8 Maths Chapter Wise
- NCERT Books and NCERT Syllabus
- Chapter Summary: NCERT Solutions for Class 8 Maths Ganita Prakash Part 2 Chapter 5
- Expert Review of NCERT Solutions for Class 8 Maths Part 2 Chapter 5

In this chapter, students are introduced to data handling, line charts and averages. It helps the students develop the analytical and interpretative skills which are essential for statistics, science, economics and everyday decision making. These NCERT Solutions for Class 8 have been prepared by our expert faculty at Careers360 to give students an important study resource. These NCERT Solutions are used by many state boards including CBSE as these latest NCERT solutions are updated for CBSE curriculum.
Class 8 Maths Part 2 Chapter 5 Solutions PDF Free Download - Ganita Prakash Book 2
Students can download the NCERT Solutions for Class 8 Maths Part 2 Chapter 5 Tales by Dots and Lines PDF by clicking the link provided below.
NCERT Solutions for Class 8 Maths Ganita Prakash Part 2 Chapter 5 Exercise Questions and Answers
Here are the NCERT Solutions for Class 8 Maths Part 2 Chapter 5 Tales by Dots and Lines question answers with clear and detailed solutions.
Class 8 Maths Part 2 Chapter 5 Question Answers with Detailed Solutions
|
Question 1. Find the mean of the following data and share your observations:
(i) The first 50 natural numbers.
(ii) The first 50 odd numbers.
(iii) The first 50 multiples of 4.
$\textbf{Answer:}$
We know that, for a set of numbers in an arithmetic progression,
Mean $=\frac{\text { First term }+ \text { Last term }}{2}$
1 (i): 25.5
$\textbf{Explanation:}$
The first 50 natural numbers are: 1, 2, 3, 4, ....50
$\therefore$ Mean $=\frac{1+50}2=\frac{51}2=25.5$
1 (ii): 50
$\textbf{Explanation:}$
The first 50 odd numbers are: 1, 3, 5, ..., 99
$\therefore$ Mean $=\frac{1+99}2=\frac{100}{2}=50$
1 (iii): 102
$\textbf{Explanation:}$
The first 50 multiples of 4 are: 4, 8, 12, ..., 200
$\therefore$ Mean $=\frac{4+200}{2}=\frac{204}2=102$
Observations:
-
The mean of equally spaced numbers is the average of the first and last terms.
-
The first 50 natural numbers have a mean of 25.5.
-
The first 50 odd numbers have a mean of 50, which is the 50th odd number itself.
-
The first 50 multiples of 4 have a mean of 102, the middle value between 4 and 200.
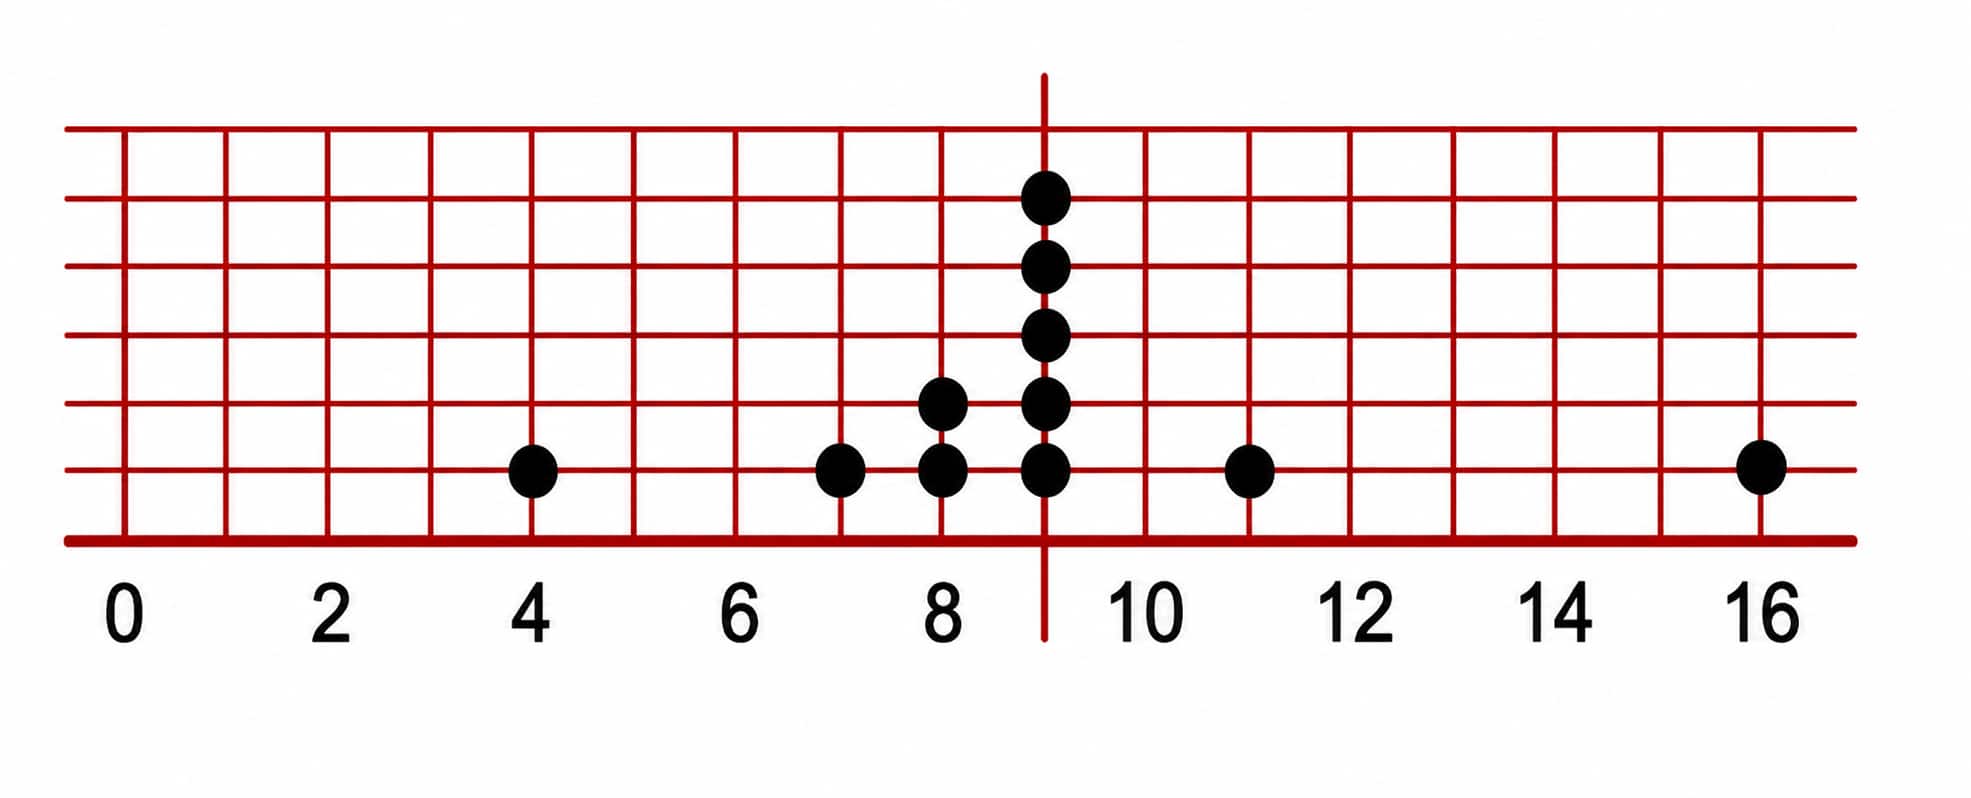
Question 2. The dot plot below shows a collection of data and its average; but one dot is missing. Mark the missing value so that the mean is 9 (as shown below).
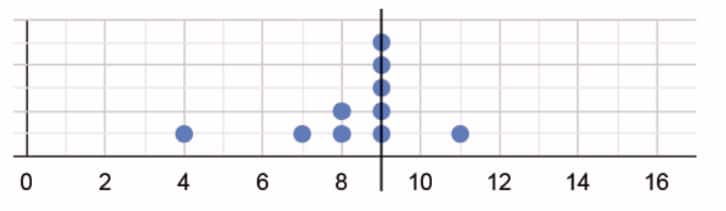
$\textbf{Answer:}$ 16
$\textbf{Explanation:}$
Let the missing number be $x$.
So, the numbers are: 4, 7, 8, 8, 9, 9, 9, 9, 9, 11, and $x$.
Total = $83+x$
Total observations = 11
The average is 9. [Given]
According to the question,
$9\times11=83-x$
$⇒83-x=99$
$⇒x=16$
Hence, the missing number is 16.
Question 3. Sudhakar, the class teacher, asks Shreyas to measure the heights of all 24 students in his class and calculate the average height. Shreyas informs the teacher that the average height is 150.2 cm. Sudhakar discovers that the students were wearing uniform shoes when the measurements were taken and the shoes add 1 cm to the height.
(i) Should the teacher get all the heights measured again without the shoes to find the correct average height? Or is there a simpler way?
(ii) What is the correct average height of the class?
(a) 174.2 cm
(b) 126.2 cm
(c) 150.2 cm
(d) 149.2 cm
(e) 151.2 cm
(f) None of the above
(g) Insufficient information
$\textbf{Answer:}$
3 (i): No.
$\textbf{Explanation:}$
We know that, if the same number is added to every observation, the mean also increases by that number. Similarly, if the same number is subtracted from every observation, the mean decreases by that number.
So, there is no need to measure all the students again. Since each student's height includes an extra 1 cm due to the shoes, we can simply subtract 1 cm from the average height.
3(ii): Option (d)
$\textbf{Explanation:}$
Correct average height $=150.2-1=149.2 \mathrm{~cm}$
Hence, the correct option is option (d).
Question 4. The three dot plots below show the lengths, in minutes, of songs of different albums. Which of these has a mean of 5.57 minutes? Explain how you arrived at the answer.
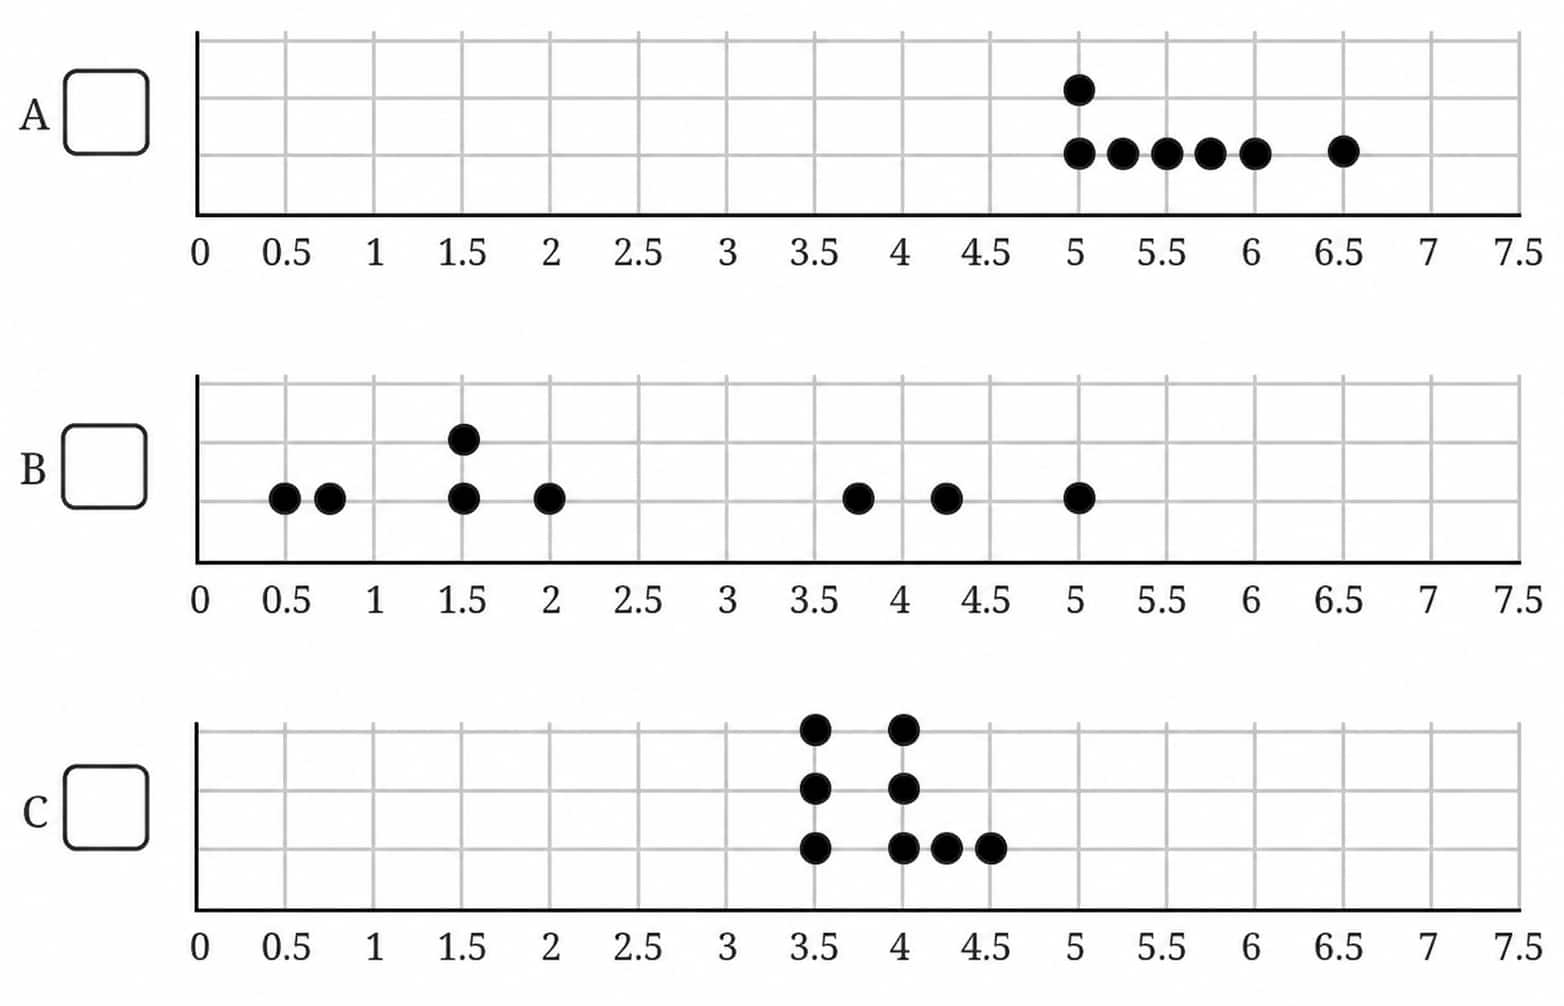
$\textbf{Answer:}$ Option (A)
$\textbf{Explanation:}$
In option (A):
Total observations = 7
Sum of the observations = 5 + 5 + 5.25 + 5.5 + 5.75 + 6 + 6.5 = 39
$\therefore$ Mean = $\frac{39}7\approx 5.57$
In option (B):
Total observations = 8
Sum of the observations = 0.5 + 0.75 + 1.5 + 1.5 + 2 + 3.75 + 4.25 + 5 = 19.25
$\therefore$ Mean = $\frac{19.25}8=2.40625\neq 5.57$
In option (C):
Total observations = 8
Sum of the observations = 3.5 + 3.5 + 3.5 + 4 + 4 + 4 + 4.25 + 4.5 = 31.25
$\therefore$ Mean = $\frac{31.25}8=3.90625\neq 5.57$
Question 5. Find the median of 8, 10, 19, 23, 26, 34, 40, 41, 41, 48, 51, 55, 70, 84, 91, 92.
(i) If we include one value to the data (in the given list) without affecting the median, what could that value be?
(ii) If we include two values to the data without affecting the median what could the two values be?
(iii) If we remove one value from the data without affecting the median what could the value be?
$\textbf{Answer:}$ 41
$\textbf{Explanation:}$
Total observations = 16
Median $=\frac{8^{\text {th }} \text { term }+9^{\text {th }} \text { term }}{2}=\frac{41+41}2=41$
5(i):
Since the 8th and 9th terms of the sequence is same, if we add any number, totla observations will be 17. That means the 9th term will be the median, which is already 41.
So, any number can be added. For example, let's add 100.
5(ii):
If we want to add two terms and the median remains 41, then add one term at the 1st position and one term at the last position.
For example, let's add 5 and 100.
5(iii):
Removing 92 still leaves the middle two terms as 41 and 41.
Question 6. Examine the statements below and justify if the statement is always true, sometimes true, or never true.
(i) Removing a value less than the median will decrease the median.
(ii) Including a value less than the mean will decrease the mean.
(iii) Including any 4 values will not affect the median.
(iv) Including 4 values less than the median will increase the median.
$\textbf{Answer:}$
6(i): Sometimes True
$\textbf{Explanation:}$
The median may decrease, remain unchanged, or even increase depending on the data.
6(ii): Always True
$\textbf{Explanation:}$
A number smaller than the current mean pulls the mean downward.
6(iii): Never True
$\textbf{Explanation:}$
Adding four values can change the middle position and hence change the median.
6(iv): Never True
$\textbf{Explanation:}$
Values below the median cannot increase the median.
Question 7. The mean of the numbers $8,13,10,4,5,20, y, 10$ is 10.375. Find the value of $y$.
$\textbf{Answer:}$ 13
$\textbf{Explanation:}$
$\text { Mean }=\frac{\text { Sum of observations }}{\text { Number of observations }}$
$⇒10.375=\frac{8+13+10+4+5+20+y+10}{8}$
$⇒10.375=\frac{70+y}{8}$
$⇒83=70+y$
$\therefore y= 13$
Question 8. The mean of a set of data with 15 values is 134. Find the sum of the data.
$\textbf{Answer:}$ 2010
$\textbf{Explanation:}$
The mean of a set of data with 15 values is 134.
Sum of data = Mean × Number of observations = 134 × 15 = 2010
Question 9. Consider the data: $12,47,8,73,18,35,39,8,29,25, p$. Which of the following number(s) could be $p$ if the median of this data is 29?
(i) 10
(ii) 25
(iii) 40
(iv) 100
(v) 29
(vi) 47
(vii) 30
$\textbf{Answer:}$ Option (iii), (iv), (v), (vi), (vii)
$\textbf{Explanation:}$
Arranging the values: 8, 8, 12, 18, 25, 29, 35, 39, 47, 73
There are 11 observations, so the median is the 6th term.
For the median to be 29, 29 must remain the 6th term after inserting $p$.
When we insert 10, the median becomes 25.
When we insert 25, the median becomes 25.
When we insert 40, the median stays 29.
When we insert 100, the median stays 29.
When we insert 29, the median stays 29.
When we insert 47, the median stays 29.
When we insert 30, the median stays 29.
Question 10. The number of times students rode their cycles in a week is shown in the dot plot below. Four students rode their cycles twice in that week.
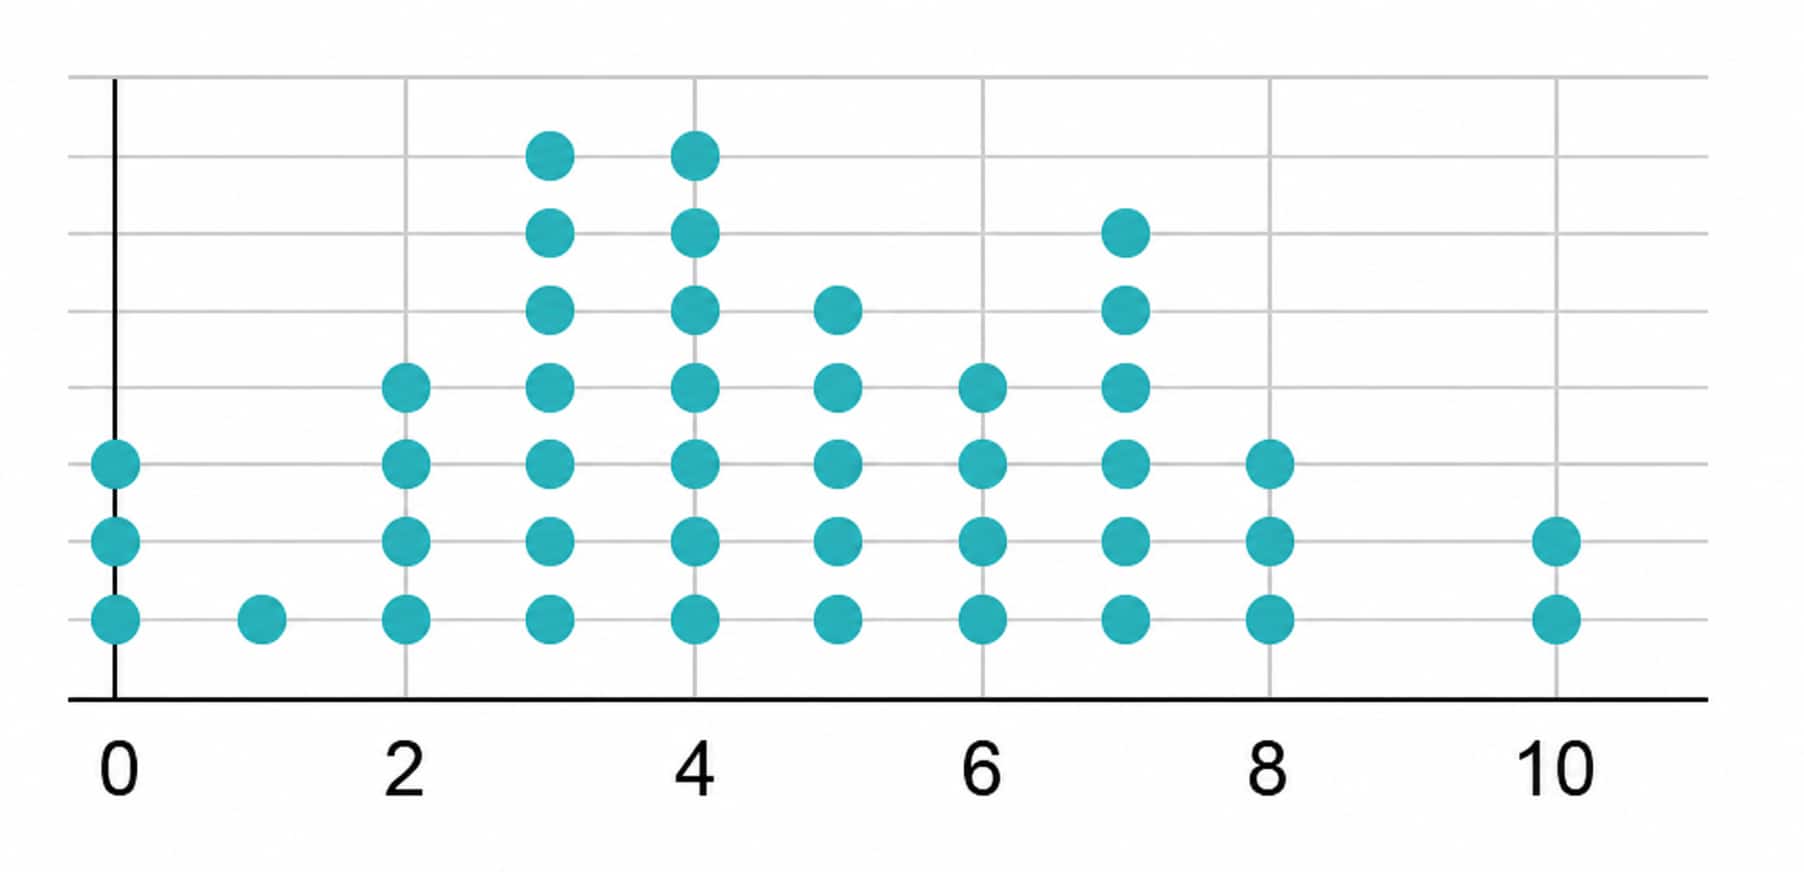
(i) Find the average number of times students rode their cycles.
(ii) Find the median number of times students rode their cycles.
(iii) Which of the following statements are valid? Why?
(a) Everyone used their cycle at least once.
(b) Almost everyone used their cycle a few times.
(c) There are some students who cycled more than once on some days.
(d) Exactly 5 students have used their cycles more than once on some days.
(iv) The following week, if all of them cycled 1 more time than they did the previous week, what would be the average and median of the next week's data?
$\textbf{Answer:}$
|
Number of times cycled |
Number of students |
|
0 |
3 |
|
1 |
1 |
|
2 |
4 |
|
3 |
7 |
|
4 |
7 |
|
5 |
5 |
|
6 |
4 |
|
7 |
6 |
|
8 |
3 |
|
9 |
0 |
|
10 |
2 |
So, total students = 3 + 1 + 4 + 7 + 7 + 5 + 4 + 6 + 3 + 2 = 42
10 (i): 4.6 times
$\textbf{Explanation:}$
The average number of times students rode their cycles
$=\frac{(0 \times 3)+(1 \times 1)+(2 \times 4)+(3 \times 7)+(4 \times 7)+(5 \times 5)+(6 \times 4)+(7 \times 6)+(8 \times 3)+(10 \times 2)}{42}$
$=\frac{193}{42}$
$\approx4.6$
10(ii): 4
$\textbf{Explanation:}$
Since there are 42 observations,
Median = average of the 21st and 22nd observations.
Cumulative frequencies:
-
Up to 0 → 3
-
Up to 1 → 4
-
Up to 2 → 8
-
Up to 3 → 14
-
Up to 4 → 22
So, Median = $\frac{4+4}2=4$
10(iii): Valid statement: Option (b)
$\textbf{Explanation:}$
Almost everyone used their cycle a few times as Most students rode their cycles between 2 and 7 times.
10(iv): 5.6 and 5
$\textbf{Explanation:}$
We know that adding the same number to every observation increases both the mean and the median by that number.
So, the new mean = 4.6 + 1 = 5.6
New Median = 4 + 1 = 5
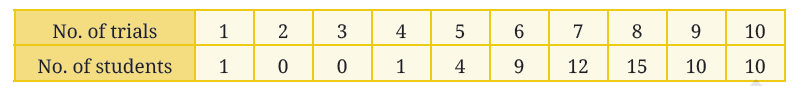
Question 11. A dart-throwing competition was organised in a school. The number of throws participants took to hit the bull's eye (the centre circle) is given in the table below. Describe the data using its minimum, maximum, mean and median.

$\textbf{Answer:}$
Minimum number of throws = 1
Maximum number of throws = 10
Total students = 1 + 1 + 4 + 9 + 12 + 15 + 10 + 10 = 62
Sum of throws
$= (1 \times 1)+(4 \times 1)+(5 \times 4)+(6 \times 9)+(7 \times 12)+$
$(8 \times 15)+(9 \times 10)+(10 \times 10) $
$=1+4+20+54+84+120+90+100$
$=473$
Therefore, Mean $=\frac{473}{62}\approx7.63$
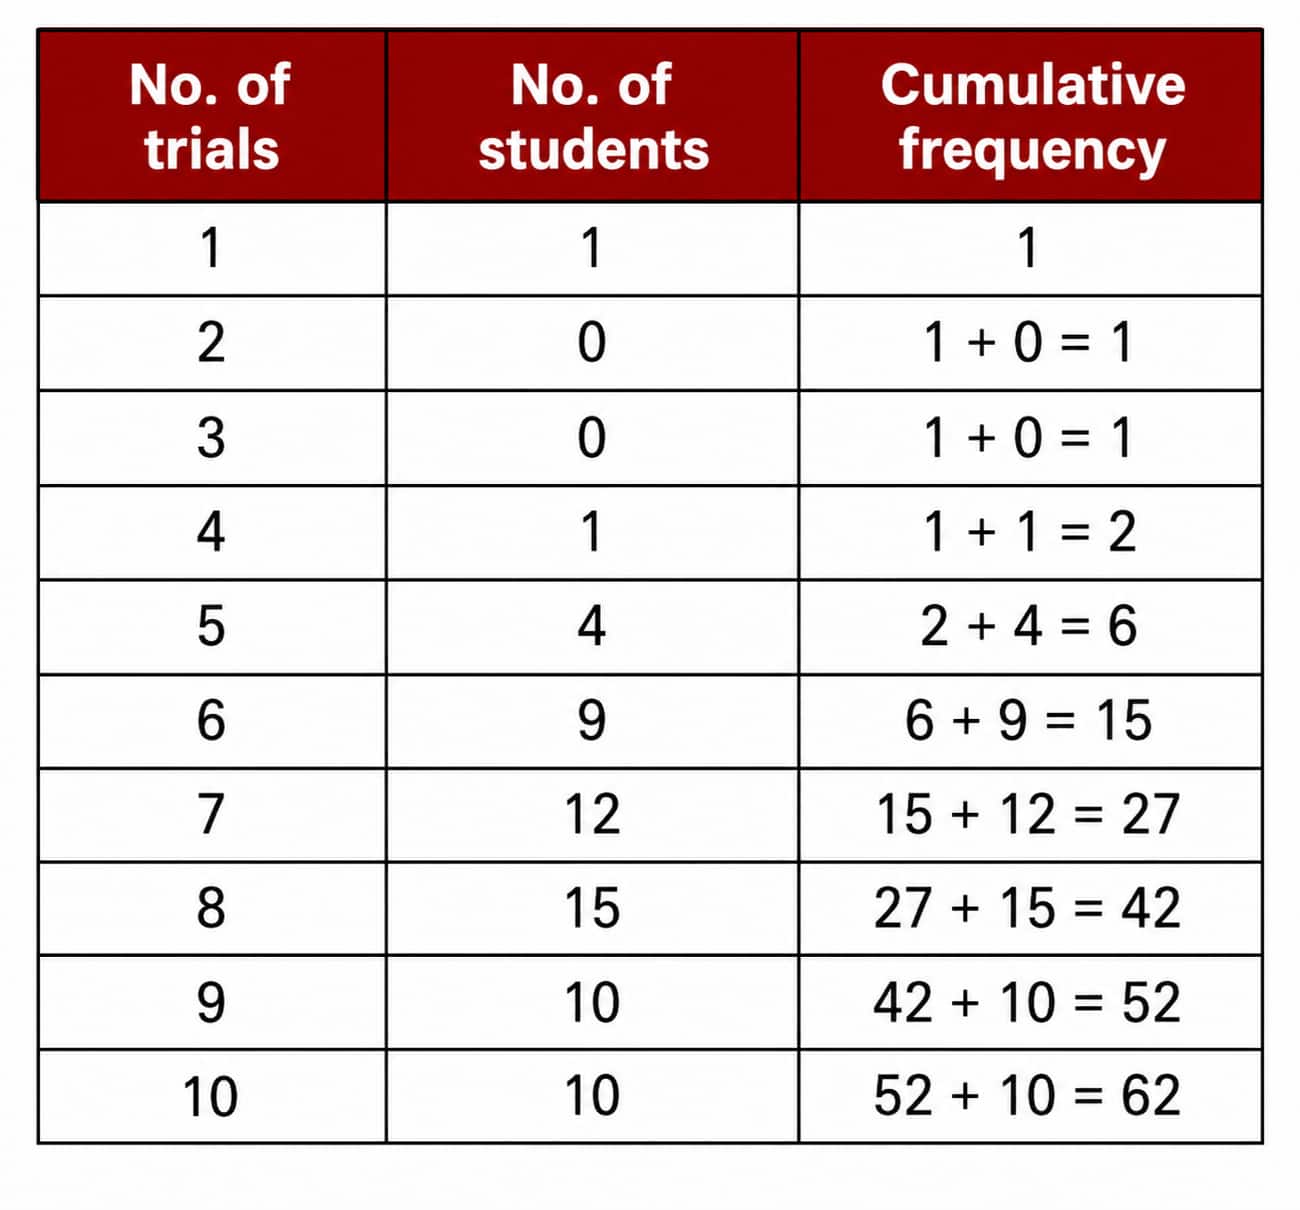
Total students = 62, so the median is the average of the 31st and 32nd observations.
The 31st and 32nd observations lie in the group corresponding to 8 throws.
So, median = 8
Class 8 Maths Part 2 Chapter 5 Question Answers with Detailed Solutions
|
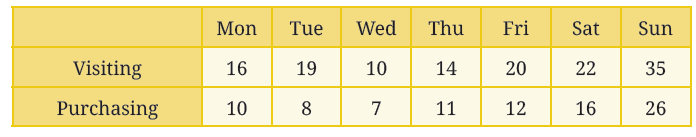
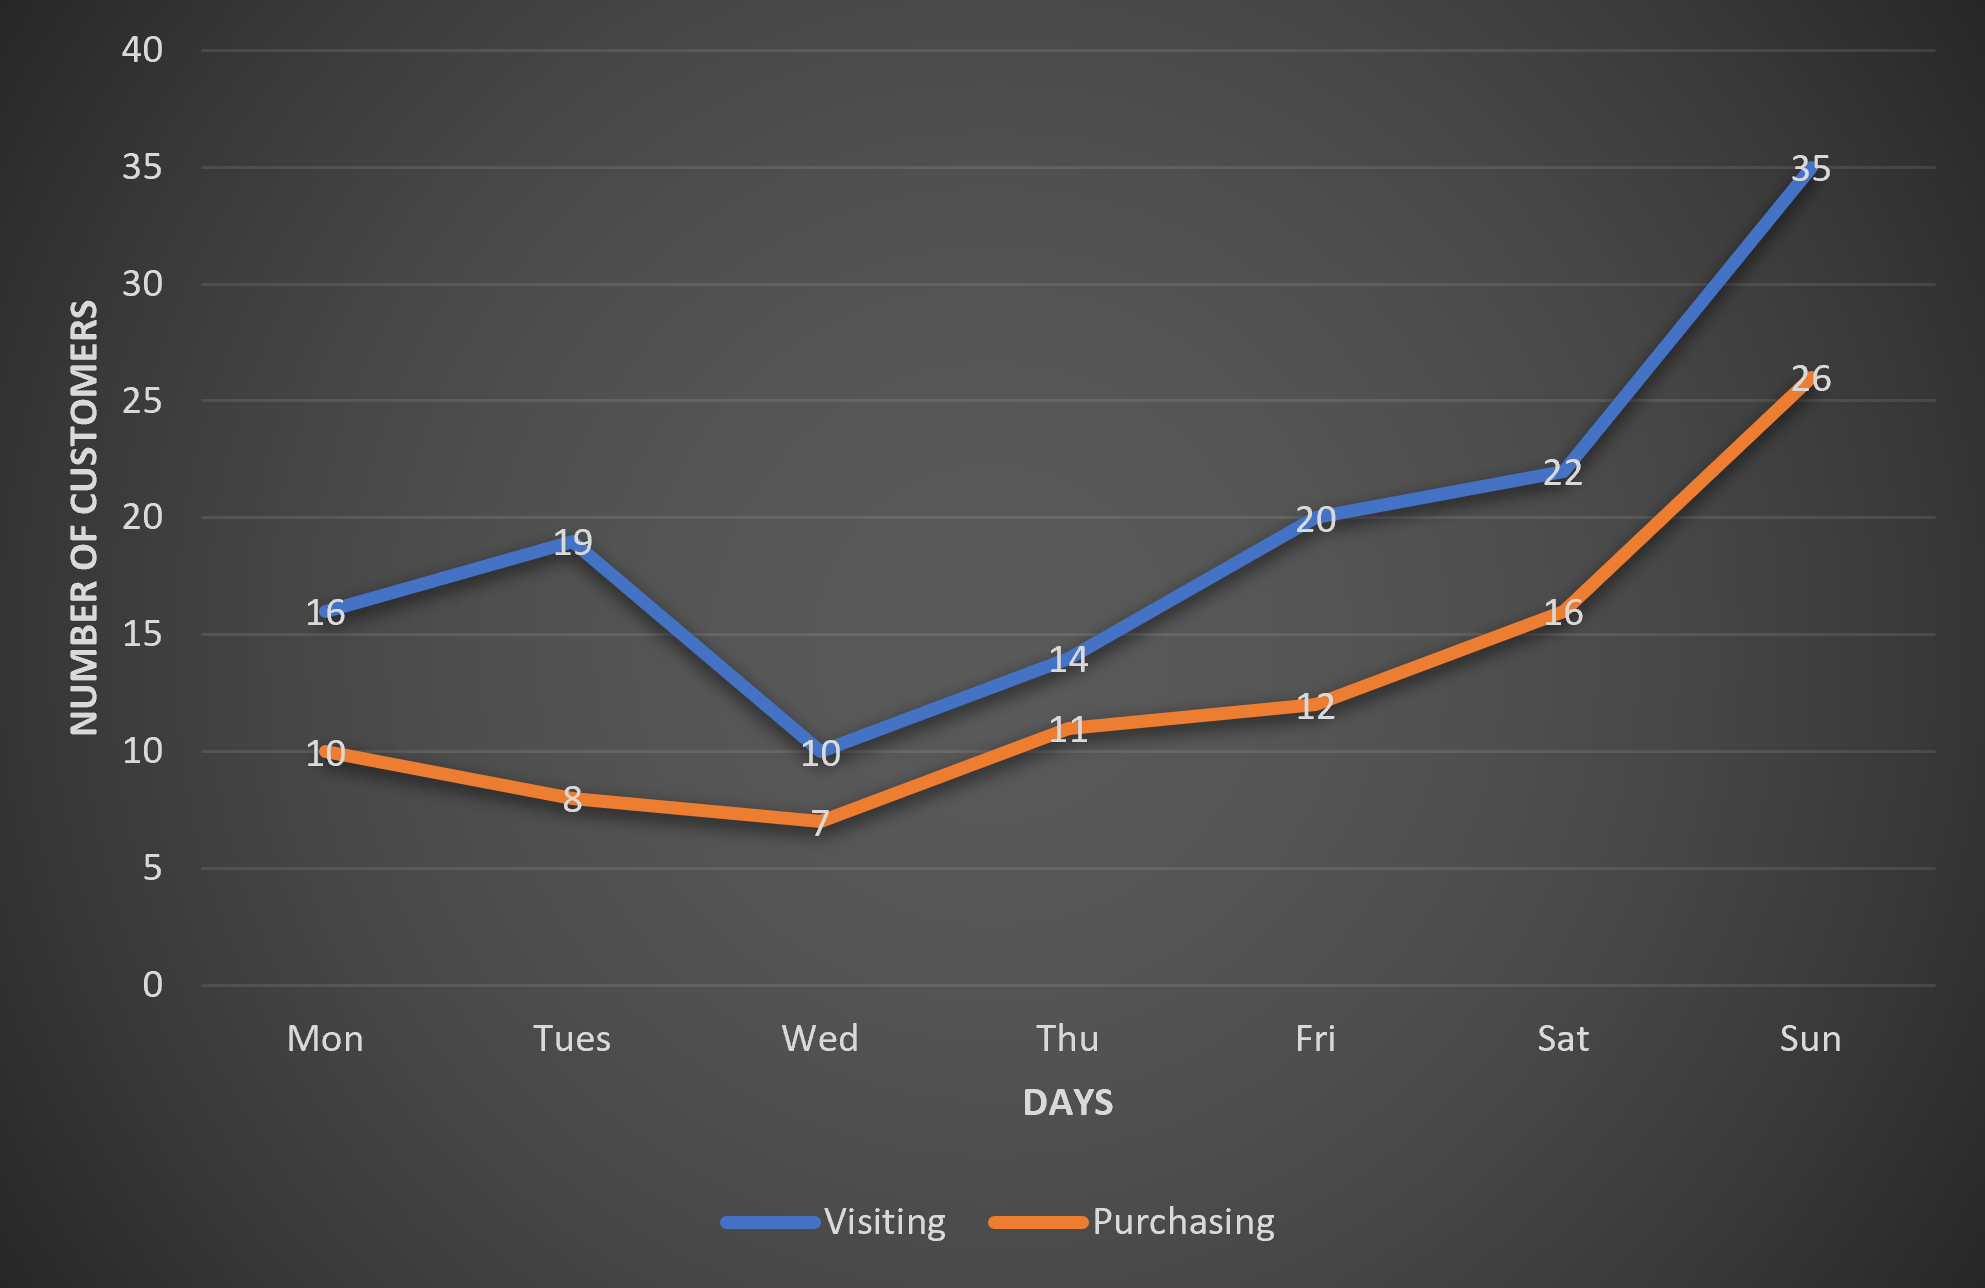
Question 1. The average number of customers visiting a shop and the average number of customers actually purchasing items over different days of the week is shown in the table below. Visualise this data on a line graph.
$\textbf{Answer:}$
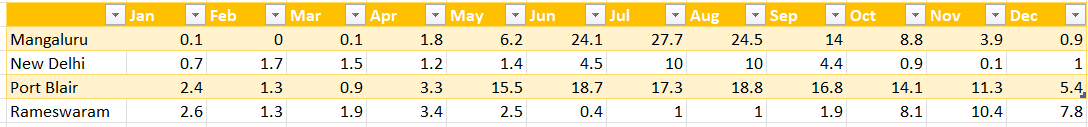
Question 2. The average number of days of rainfall in each month for a few cities is shown in the table below:
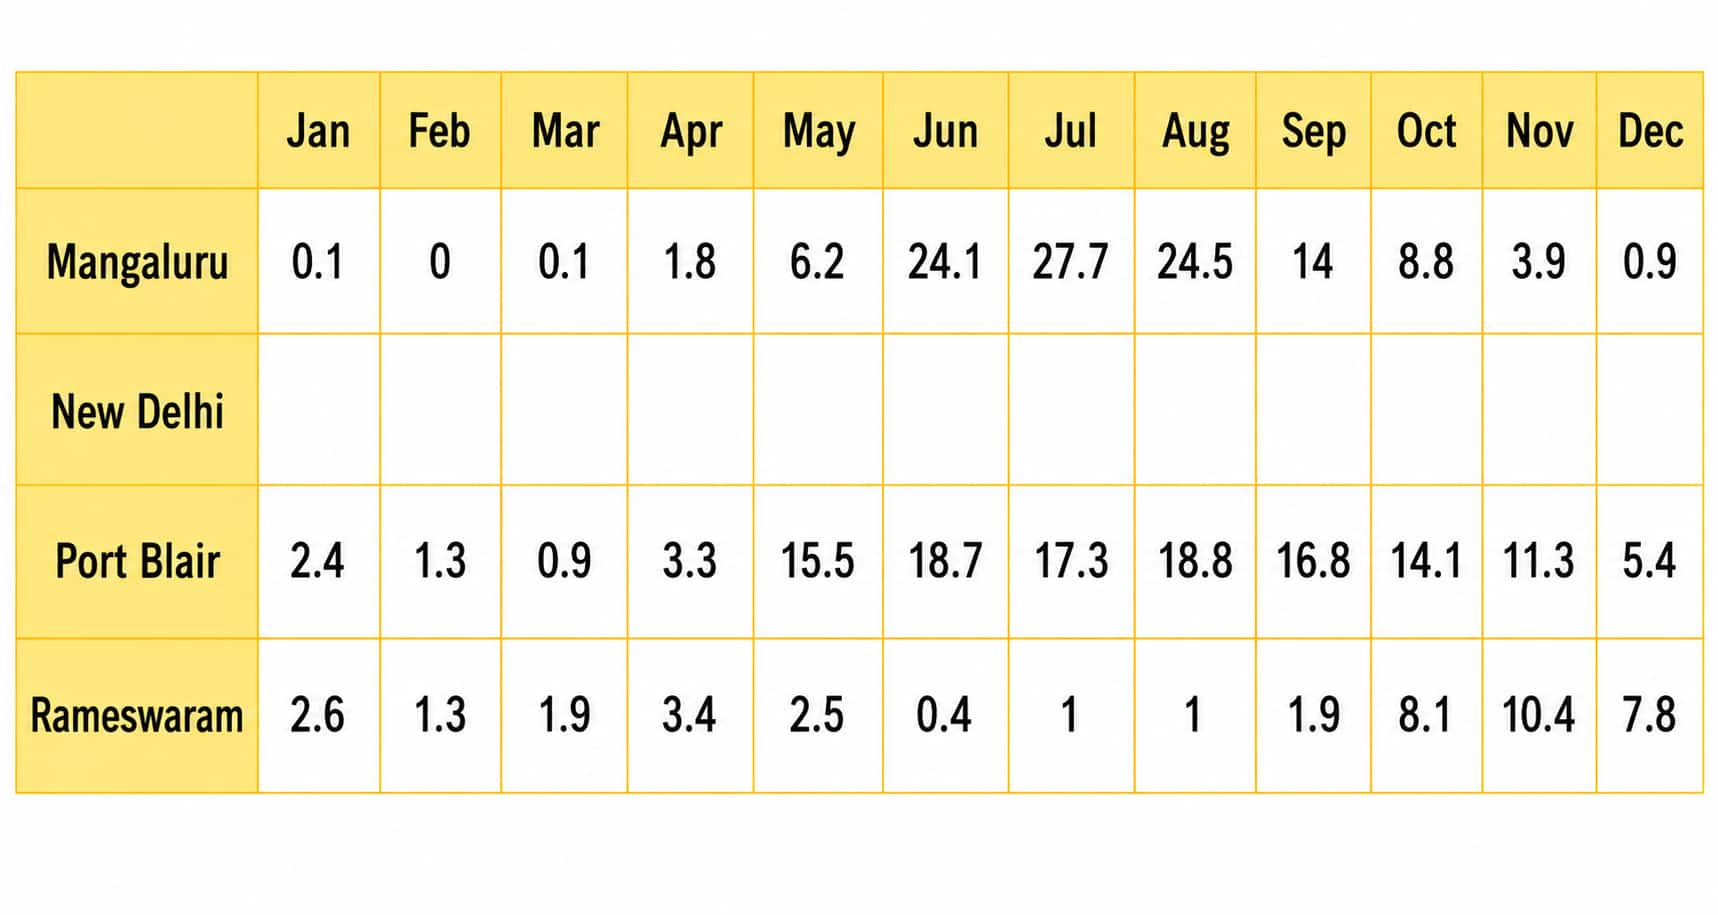
(i) What could be the possible method to compile this data?
(ii) Mark the data for Mangaluru, Port Blair, and Rameswaram in the line graph shown below. You can round off the values to the nearest integer.
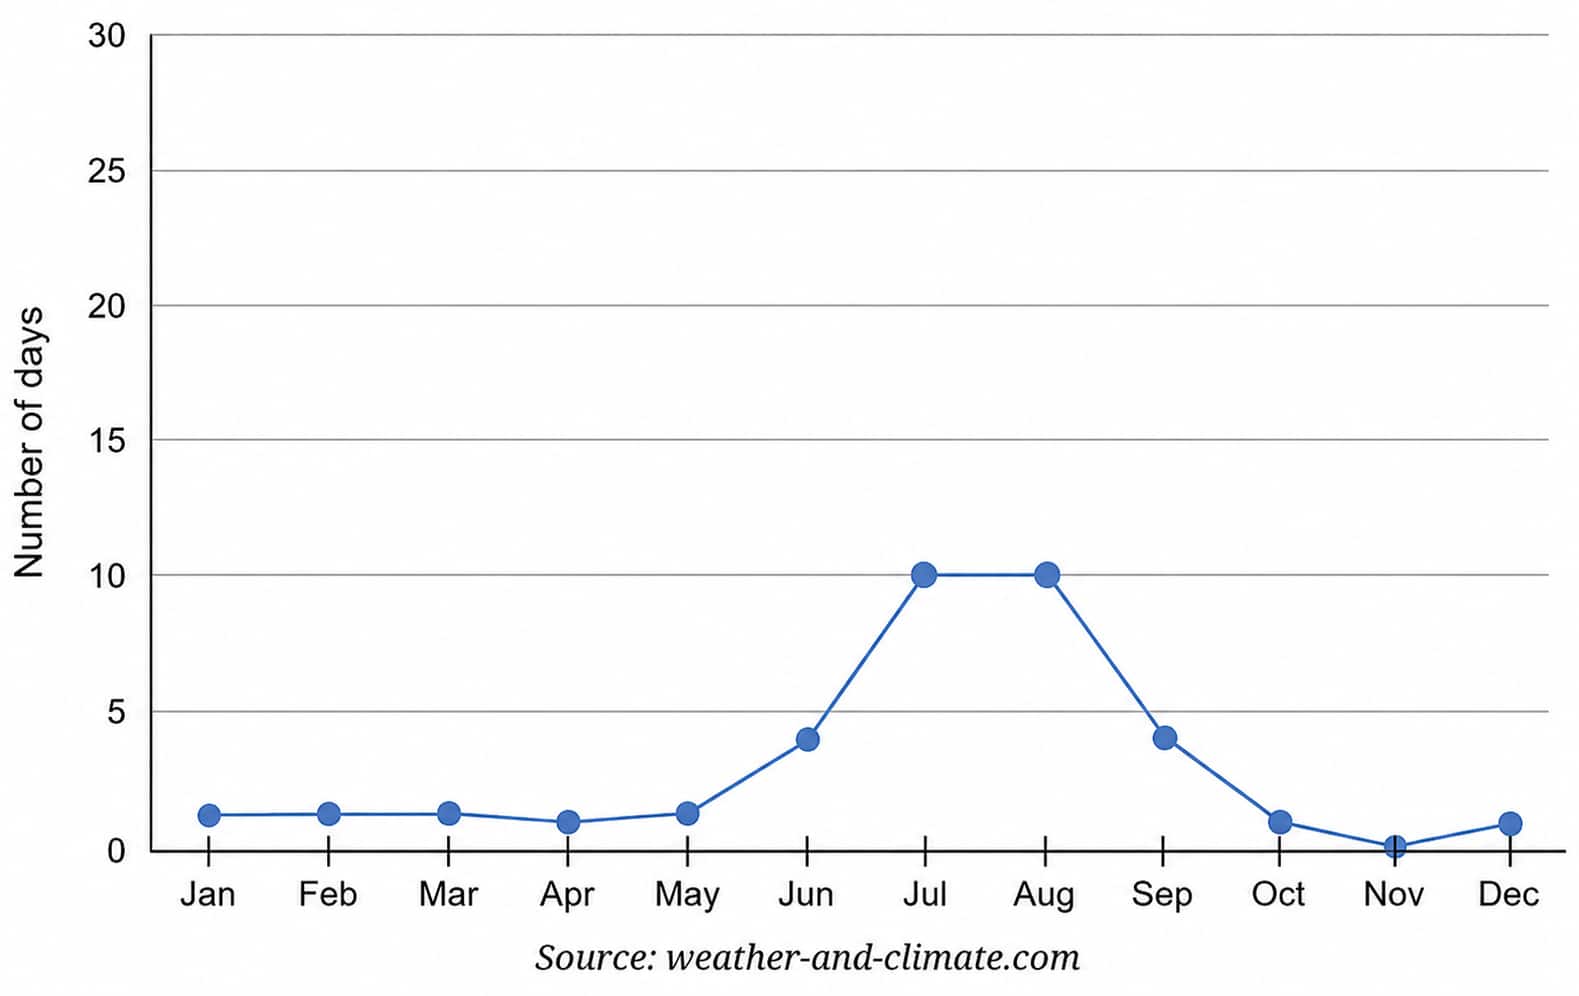
(iii) Based on the line for New Delhi in the graph fill the data in the table.
(iv) Which city among these receives the most number of days of rainfall per year? Which city gets the least number of days of rainfall per year?
(v) Looking at the table, when is the rainy season in New Delhi and Rameswaram?
$\textbf{Answer:}$
2(i):
We can use a line graph to represent this data and visualise it better.
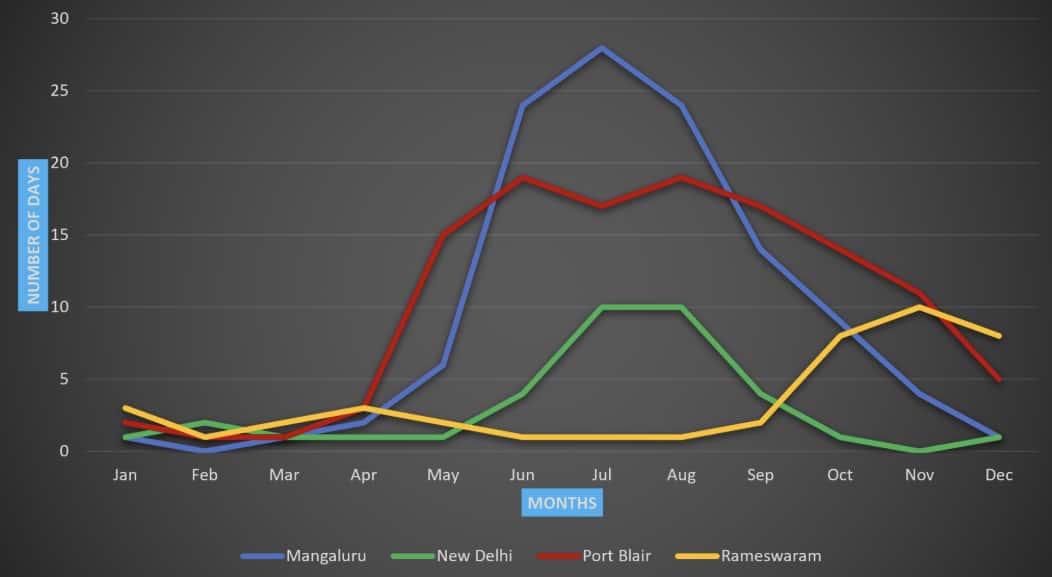
2(ii):
2 (iii):
2(iv):
Port Blair receives the most number of days of rainfall per year. Approximately 126 days.
New Delhi receives the least number of days of rainfall per year. Approximately 38 days.
2(v):
According to the table,
In Delhi, the rainy season starts in June, peaks in July and August, and fades during September.
In Rameswaram, the rainy season usually lasts from October to December.
Question 3. The following line graph shows the number of births in every month in India over a time period:
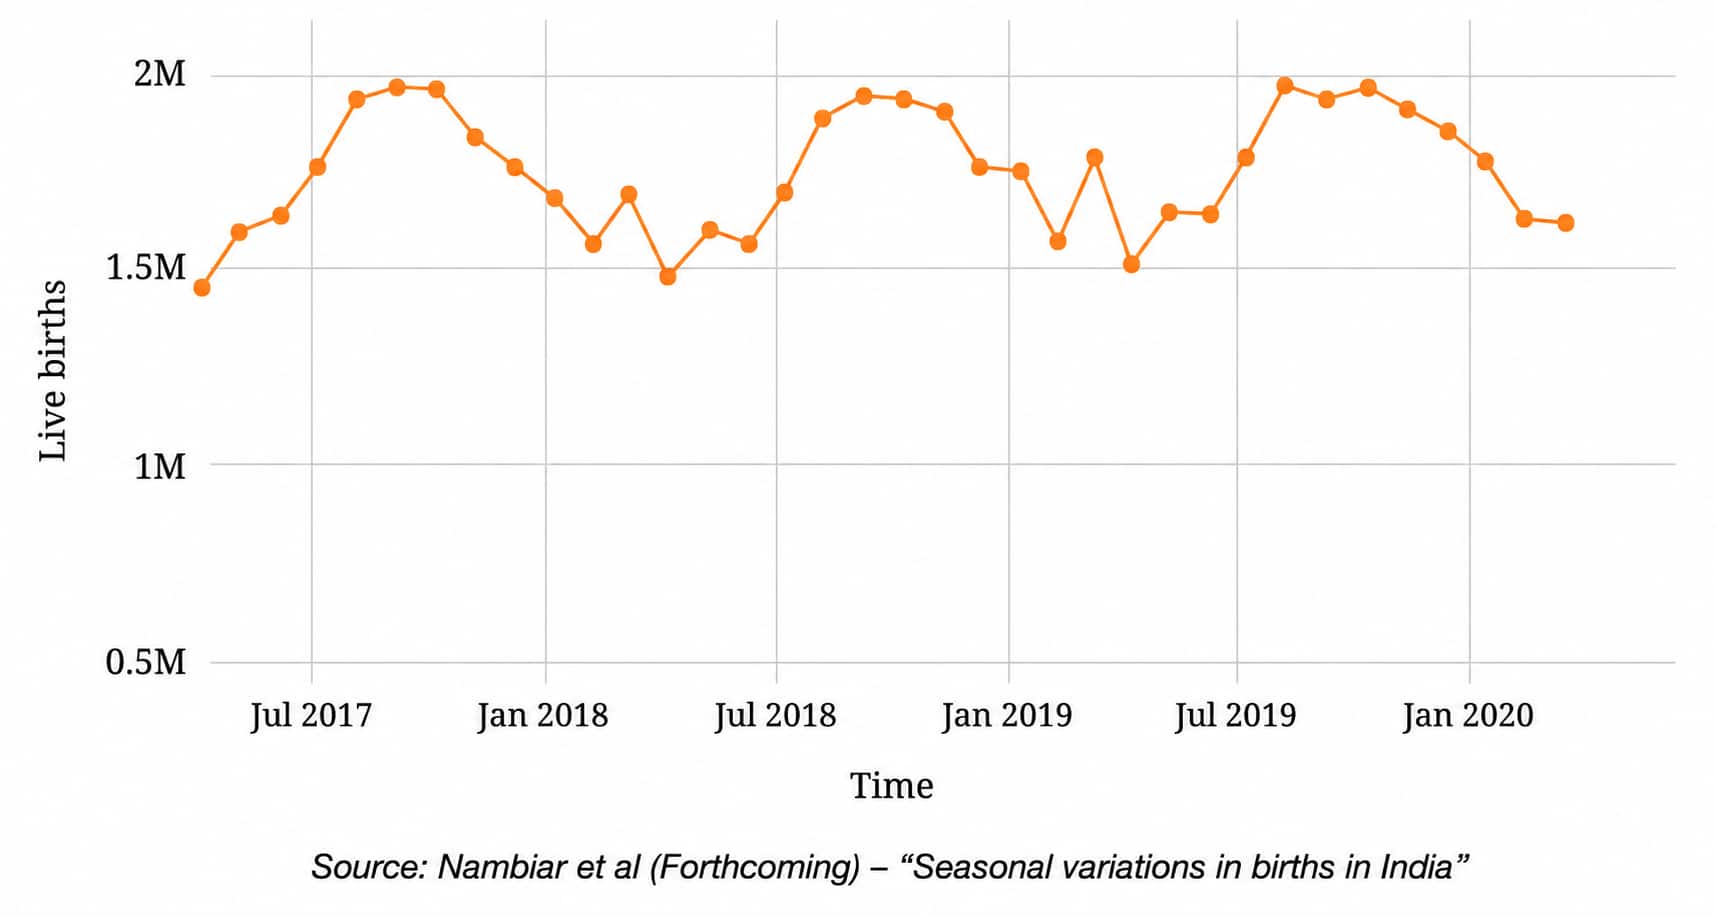
(i) What are your observations?
(ii) What was the approximate number of births in July 2017?
(iii) What time period does the graph capture?
(iv) Compare the number of births in the month of January in the years 2018, 2019, and 2020.
(v) Estimate the number of births in the year 2019.
$\textbf{Answer:}$
3(i):
Here are the observations:
-
The number of live births shows a clear seasonal pattern, rising and falling regularly over the years.
-
Births generally peak around August-October each year.
-
The lowest values are usually observed around March-May.
-
The monthly number of births varies approximately between 1.4 million and 1.95 million.
3(ii):
In July 2017, the graph shows approximately 1.75 million births.
3(iii):
The graph covers the period from approximately April 2017 to March 2020, spanning about three years.
3(iv):
|
Births in January | |
|---|---|
|
Year |
Approximate Births |
|
2018 |
1.6 million |
|
2019 |
1.7 million |
|
2020 |
1.7 million |
3(v):
Approximate monthly values for 2019 Births
= 1.7 + 1.7 + 1.5 + 1.8 + 1.4 + 1.6 + 1.6 + 1.8 + 1.95 + 1.9 + 1.85 + 1.8
≈ 20.6 million births
Class 8 Maths Part 2 Chapter 5 Question Answers with Detailed Solutions
|
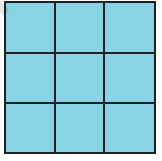
Question 1. Mean Grids:
(i) Fill the grid with 9 distinct numbers such that the average along each row, column, and diagonal is 10.
(ii) Can we fill the grid by changing a few numbers and still get 10 as the average in all directions?
$\textbf{Answer:}$
1(i):
Average = 10
So, sum of all three boxes along each row, column, and diagonal = 10 × 3 = 30
Here is the required grid.
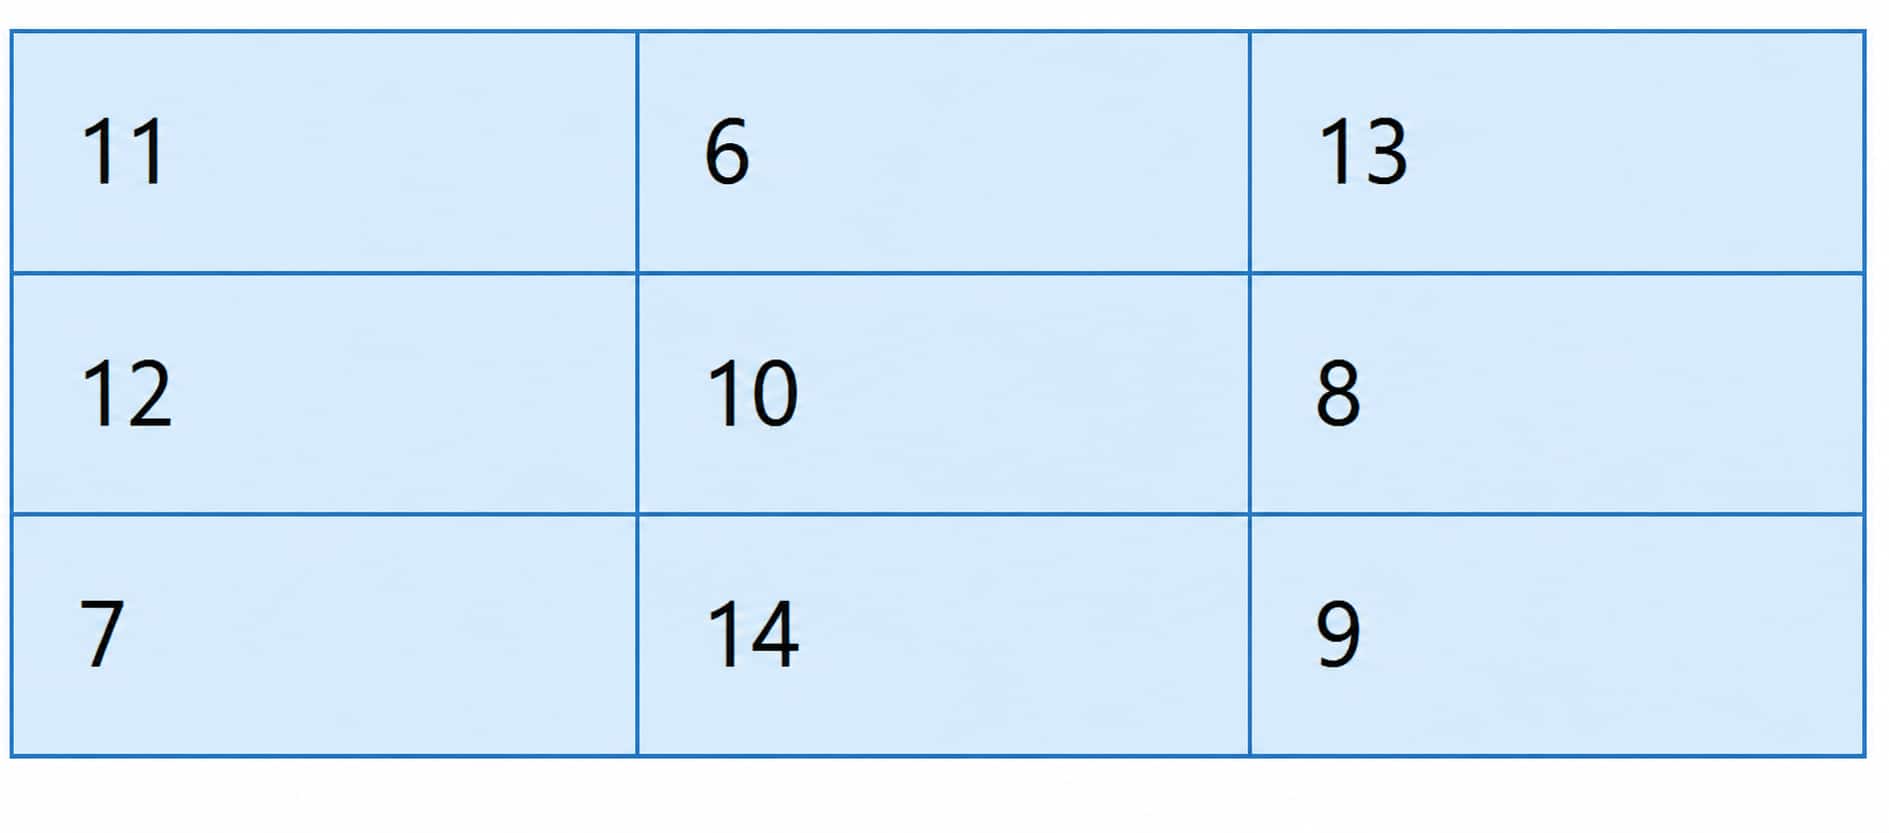
1(ii):
If we keep 10 at the centre and change the other numbers in pairs such that each pair still adds up to 20, the row, column, and diagonal sums will remain 30.
Here is the required grid.
Question 2. Give two examples of data that satisfy each of the following conditions:
(i) 3 numbers whose mean is 8.
(ii) 4 numbers whose median is 15.5.
(iii) 5 numbers whose mean is 13.6.
(iv) 6 numbers whose mean = median.
(v) 6 numbers whose mean > median.
$\textbf{Answer:}$
2(i): 7, 8, 9
$\textbf{Explanation:}$
Total numbers = 3
Sum of the numbers = 7 + 8 + 9 = 24
$\therefore$ Mean $=\frac{24}3=8$
2(ii): 12, 15, 16, 20
$\textbf{Explanation:}$
Median = average of the middle two numbers
⇒ Median $=\frac{15+16}2=15.5$
2(iii): 8, 12, 13, 15, 20
$\textbf{Explanation:}$
Mean = 13.6
Total numbers = 5
Total = 13.6 × 5 = 68
So, the sum of the numbers has to be 68.
8 + 12 + 13 + 15 + 20 = 68
2(iv): 2, 4, 6, 8, 10, 12
$\textbf{Explanation:}$
Mean $=\frac{42}{6}=7 $
Median $=\frac{6+8}{2}=7$
So, Mean = Median
2(v): 2, 4, 6, 8, 10, 18
$\textbf{Explanation:}$
Mean $=\frac{48}{6}=8$
Median $=\frac{6+8}{2}=7$
So, Mean > Median
Question 3. Fill in the blanks such that the median of the collection is 13: 5, 21, 14, $\_\_\_\_$, $\_\_\_\_$, $\_\_\_\_$. How many possibilities exist if only counting numbers are allowed?
$\textbf{Answer:}$ 0 Possibilities
$\textbf{Explanation:}$
Known Sequence after rearrange: 5, 14, 21
So, Median $=\frac{3 \mathrm{rd} \text { term }+4 \mathrm{th} \text { term }}{2}=13$
Since 14 is already present, after arranging the numbers in ascending order, the 3rd and 4th terms cannot average to 13, because one of them must be at least 14.
Therefore, no set of counting numbers is possible.
Question 4. Fill in the blanks such that the mean of the collection is 6.5: 3, 11, $\_\_\_\_$,
$\_\_\_\_$ , 15, 6.
How many possibilities exist if only counting numbers are allowed?
$\textbf{Answer:}$ 3 possibilities
$\textbf{Explanation:}$
Total numbers = 6
Total = $6 \times 6.5=39$
Sum of known numbers = 3 + 11 + 15 + 6 = 35
Therefore, sum of remaining two numbers = 39 - 35 = 4
So, the possible number pairs are: (1, 3), (2, 2), (3, 1)
Question 5. Check whether each of the statements below is true. Justify your reasoning. Use algebra, if necessary, to justify.
(i) The average of two even numbers is even.
(ii) The average of any two multiples of 5 will be a multiple of 5.
(iii) The average of any 5 multiples of 5 will also be a multiple of 5.
$\textbf{Answer:}$
5(i): False
$\textbf{Explanation:}$
Let the numbers be $2 a$ and $2 b$.
$\text { Average }=\frac{2 a+2 b}{2}=a+b$
$a+b$ may be odd or even.
Example: Two even numbers, 8 and 10.
Their mean = $\frac{8+10}2=9$, which is not even
5(ii): False
$\textbf{Explanation:}$
Two multiples of 5: 15, 30
Their average $=\frac{15+30}2=22.5$, which is not a multiple of 5
5(iii): Sometimes True
$\textbf{Explanation:}$
Let the numbers be $5 a, 5 b, 5 c, 5 d, 5 e$
Average:$\frac{5(a+b+c+d+e)}{5}=a+b+c+d+e$
But it is not true all the time.
Five multiples of 5: 10, 15, 20, 30, 35
Their average $=\frac{10+15+20+25+30}5=20$, which is a multiple of 5
Five multiples of 5: 10, 10, 20, 30, 35
Their average $=\frac{10+10+20+25+30}5=19$, which is not a multiple of 5
Question 6. There were 2 new admissions to Sudhakar's class just a couple of days after the class average height was found to be 150.2 cm.
(i) Which of the following statements are correct? Why?
(a) The average height of the class will increase as there are 2 new values.
(b) The average height of the class will remain the same.
(c) The heights of the new students have to be measured to find out the new average height.
(d) The heights of everyone in the class has to be measured again to calculate the new average height.
(ii) The heights of the two new joinees are 149 cm and 152 cm . Which of the following statements about the class' average height are correct? Why?
(a) The average will remain the same.
(b) The average will increase.
(c) The average will decrease.
(d) The information is not sufficient to make a claim about the average.
(iii) Which of the following statements about the new class average height are correct? Why?
(a) The median will remain the same.
(b) The median will increase.
(c) The median will decrease.
(d) The information is not sufficient to make a claim about median.
$\textbf{Answer:}$
6(i): Option (c)
$\textbf{Explanation:}$
The heights of the new students have to be measured to find the new average.
6(ii): Option (b)
$\textbf{Explanation:}$
New heights are 149 cm and 152 cm.
Average $\frac{149+152}{2}=150.5 \mathrm{~cm}$
Since 150.5 > 150.2, adding these students will increase the class average.
6(iii): Option (d)
$\textbf{Explanation:}$
The effect on the median depends on where 149 cm and 152 cm fit among all class heights.
It may increase, decrease, or remain unchanged.
Question 7. Is 17 the average of the data shown in the dot plot below? Share the method you used to answer this question.
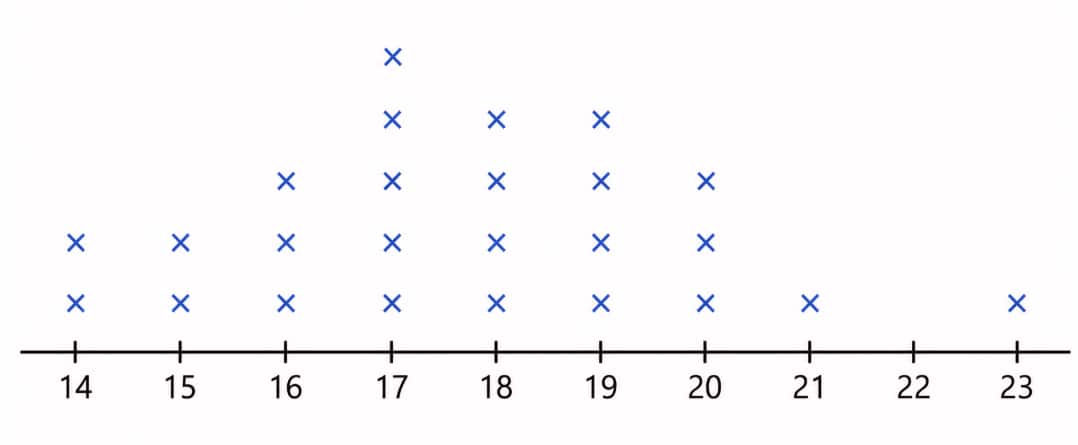
$\textbf{Answer:}$ 17.72
$\textbf{Explanation:}$
We have used the technique of weighted average.
Formula:
Weighted Average $=\frac{\text { Sum of weighted terms }}{\text { Total Number of terms }}$
|
Value (x) |
Frequency (f) |
|
14 |
2 |
|
15 |
2 |
|
16 |
3 |
|
17 |
5 |
|
18 |
4 |
|
19 |
4 |
|
20 |
3 |
|
21 |
1 |
|
22 |
0 |
|
23 |
1 |
Sum of the values
$=(14 \times 2)+(15 \times 2)+(16 \times 3)+(17 \times 5)$
$+(18 \times 4)+(19 \times 4)+(20 \times 3)+21+23$
$=443$
Total observations
= 2 + 2 + 3 + 5 + 4 + 4 + 3 + 1 + 1
= 25
So, mean $=\frac{443}{25}=17.72$
Question 8. The weights of people in a group were measured every month. The average weight for the previous month was 65.3 kg and the median weight was 67 kg. The data for this month showed that one person has lost 2 kg and two have gained 1 kg. What can we say about the change in mean weight and median weight this month?
$\textbf{Answer:}$
Total change in weight = (–2) + 1 + 1 = 0
Since the total weight of the group has not changed and the number of people remains the same, the mean weight remains unchanged.
$\therefore$ Mean weight of this month is 65.3 kg.
The median depends on the middle value(s) after arranging all the weights in order. We do not know:
-
which people gained or lost weight,
-
whether any of them were near the middle of the data,
-
Or how the ordered list changed.
Therefore, the median could: remain 67 kg, increase, or decrease.
$\therefore$ Median of this month cannot be determined from the given information.
Question 9. The following table shows the retail price (in ₹) of iodised salt in the month of January in a few states over 10 years. For your calculations and plotting you may round off values to the nearest counting number.
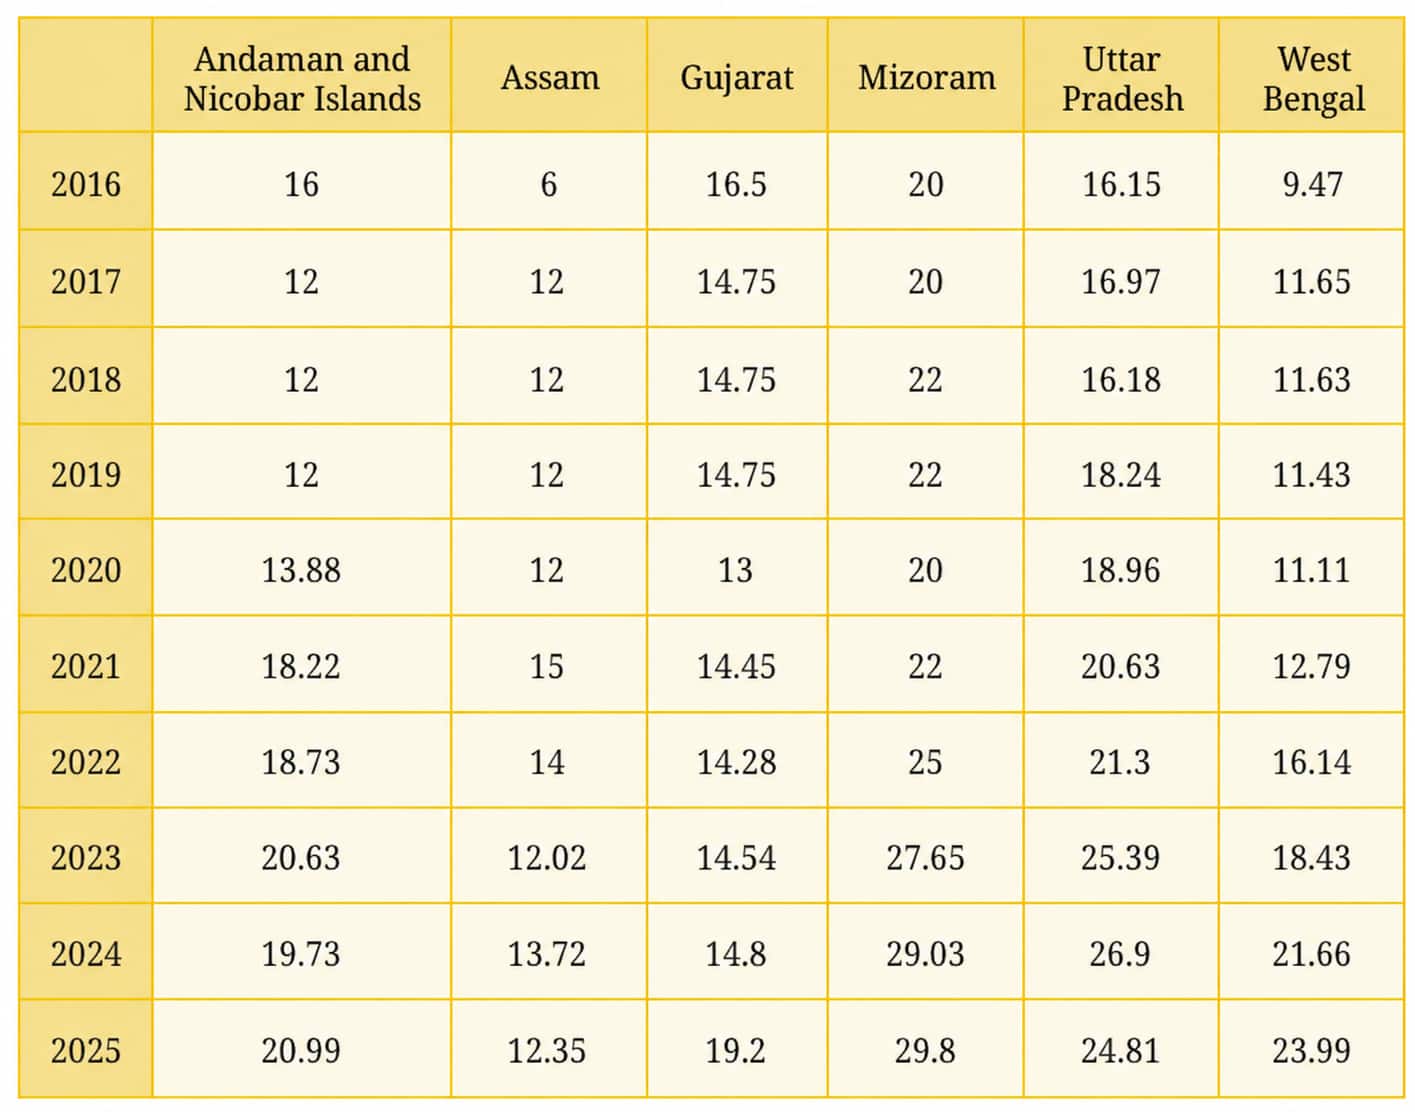
(i) Choose data from any 3 states you find interesting and present it through a line graph using an appropriate scale.
(ii) What do you find interesting in this data? Share your observations.
(iii) Compare the price variation in Gujarat and Uttar Pradesh.
(iv) In which state has the price increased the most from 2016 to 2025?
(v) What are you curious to explore further?
$\textbf{Answer:}$
9(i):
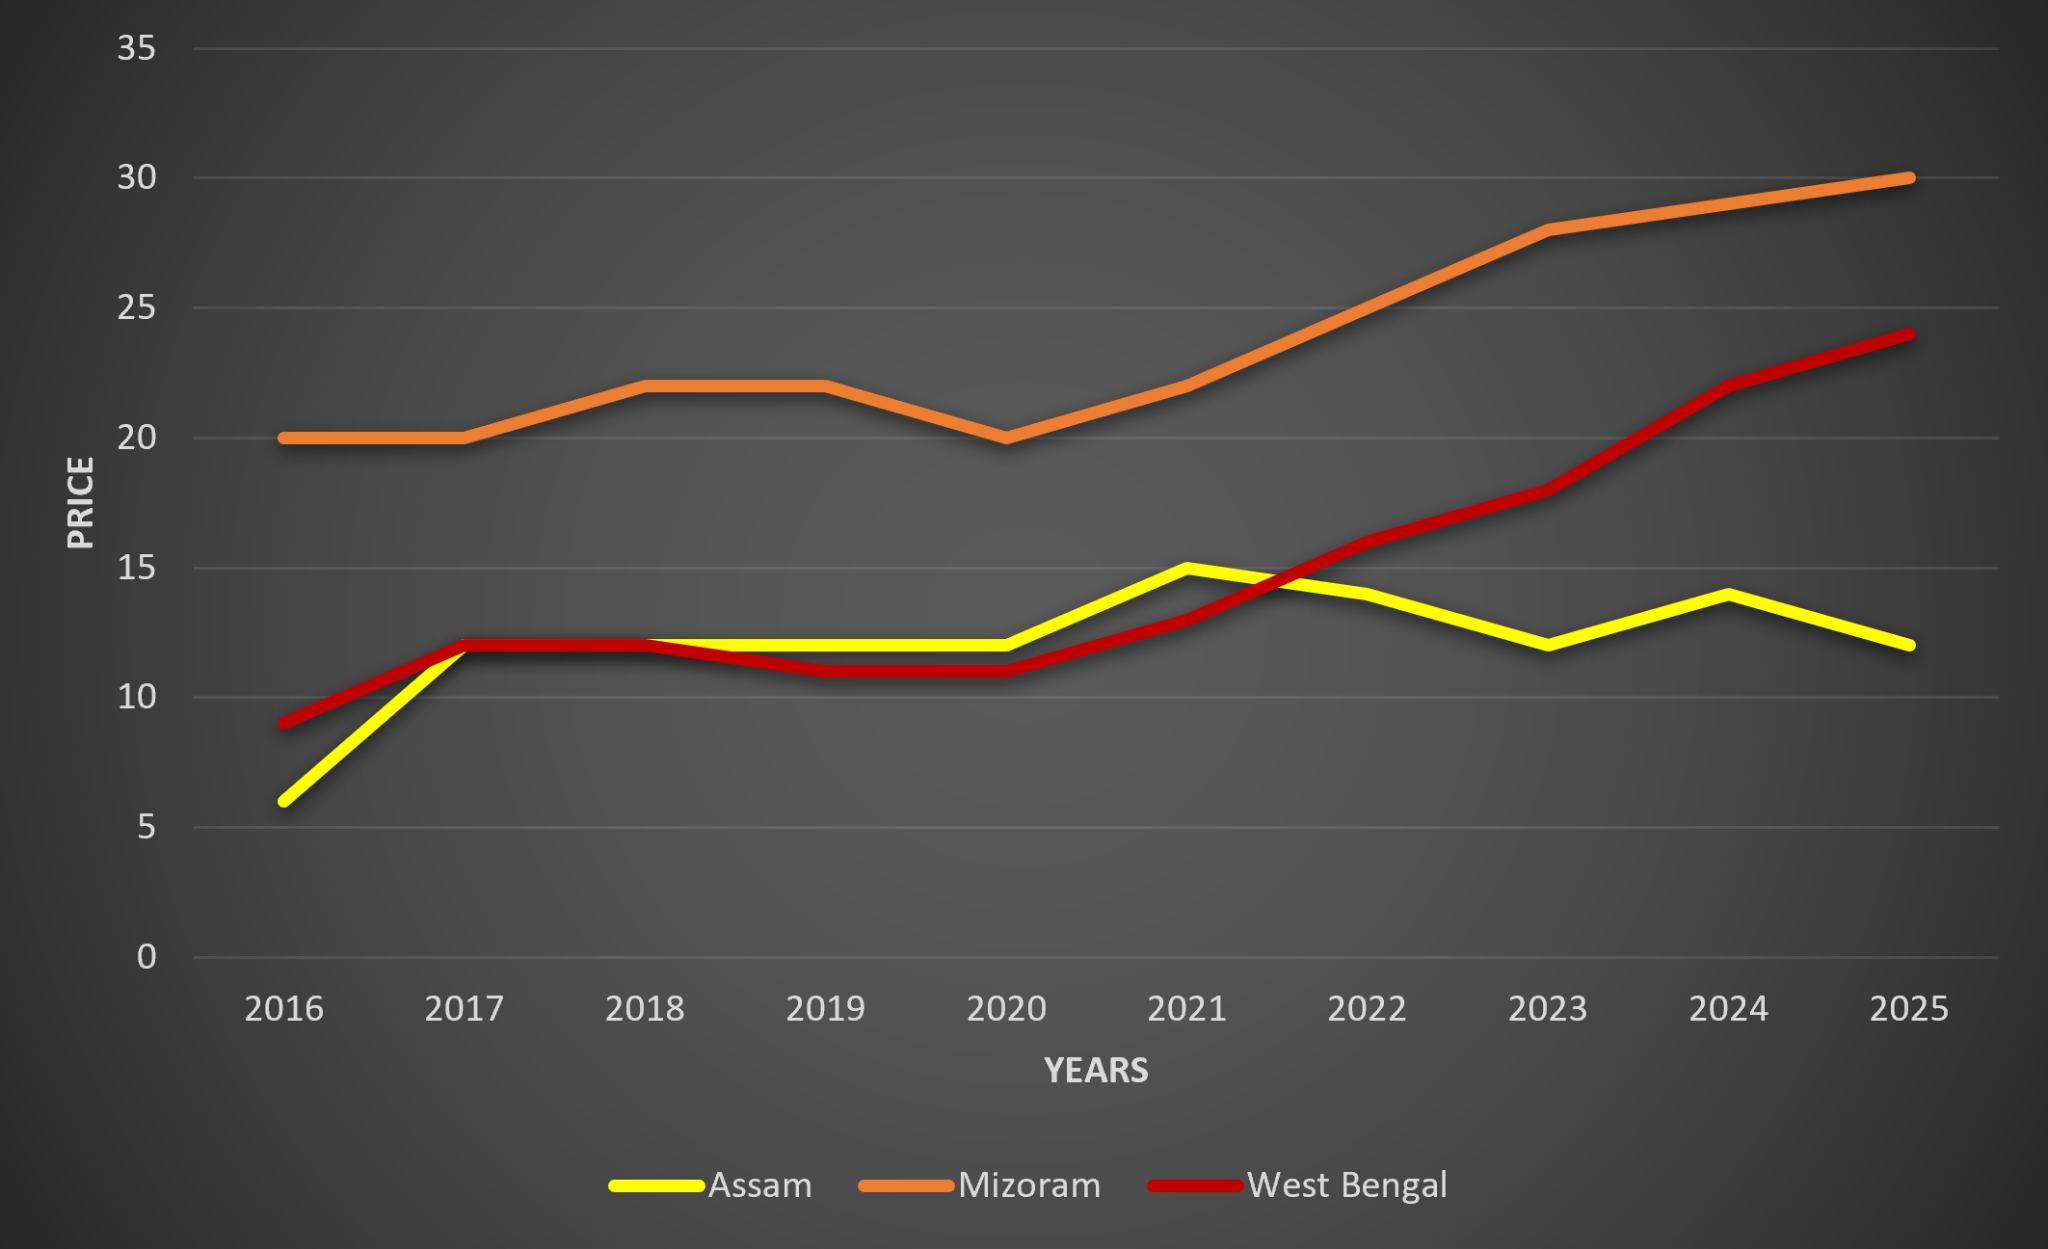
9(ii):
Observations:
-
Mizoram has the highest prices throughout the years and shows a steady rise from 20 (2016) to 29.8 (2025).
-
Assam has the lowest values among the given states in most years.
-
West Bengal shows a sharp increase after 2021, rising from 12.79 in 2021 to 23.99 in 2025.
-
Andaman and Nicobar Islands experienced a drop from 16 (2016) to 12 (2017-2019), followed by a continuous increase afterwards.
-
Most states show an overall upward trend in prices over the ten years.
9(iii):
|
Year |
Gujarat |
Uttar Pradesh |
|
2016 |
16.50 |
16.15 |
|
2025 |
19.20 |
24.81 |
Gujarat remained relatively stable, with small fluctuations between 13 and 19.2.
Uttar Pradesh showed a much larger increase and rose steadily after 2018.
All in all, Uttar Pradesh experienced much greater price variation than Gujarat.
9(iv): West Bengal
$\textbf{Explanation:}$
|
State |
2016 |
2025 |
Increase |
|
Andaman & Nicobar Islands |
16.00 |
20.99 |
+4.99 |
|
Assam |
6.00 |
12.35 |
+6.35 |
|
Gujarat |
16.50 |
19.20 |
+2.70 |
|
Mizoram |
20.00 |
29.80 |
+9.80 |
|
Uttar Pradesh |
16.15 |
24.81 |
+8.66 |
|
West Bengal |
9.47 |
23.99 |
+14.52 |
9(v):
We can explore:
-
Why did West Bengal's prices increase so rapidly after 2021?
-
Why did Gujarat remain comparatively stable over the years?
-
What factors caused Mizoram to consistently have the highest prices?
Question 10. Referring to the graph below, which of the following statements are valid? Why?
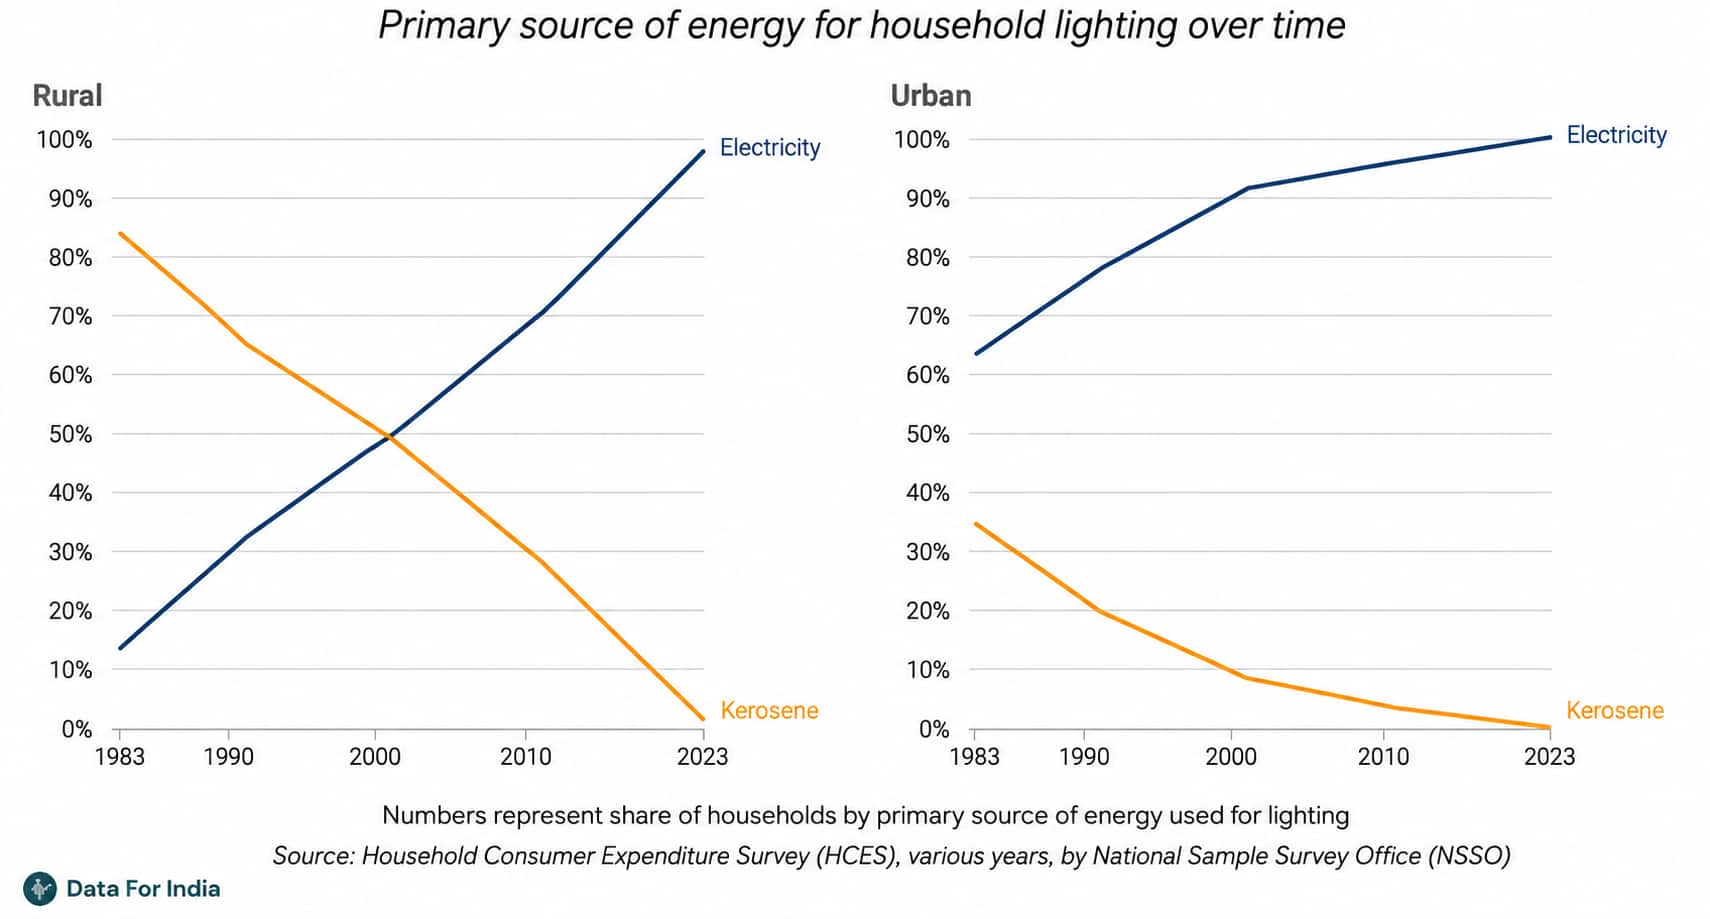
(i) In 1983, the majority in rural areas used kerosene as a primary lighting source while the majority in urban areas used electricity.
(ii) The use of kerosene as a primary lighting source has decreased over time in both rural and urban areas.
(iii) In the year 2000, $10 \%$ of the urban households used electricity as a primary lighting source.
(iv) In 2023, there were no power cuts.
$\textbf{Answer:}$
10(i): Valid
$\textbf{Explanation:}$
From the graph, about 84% of rural households used kerosene, whereas about 64% of urban households used electricity in 1983.
10(ii): Valid
$\textbf{Explanation:}$
The kerosene line continuously falls from 1983 to 2023 in both rural and urban areas, showing a steady decline.
10(iii): Not valid
$\textbf{Explanation:}$
In 2000, around 90% of urban households used electricity, while only about 10% used kerosene.
10(iv): Not valid
$\textbf{Explanation:}$
The graph only shows the primary source of lighting used by households. It does not provide any information about power cuts, so this conclusion cannot be drawn.
Question 11. Answer the following questions based on the line graph.
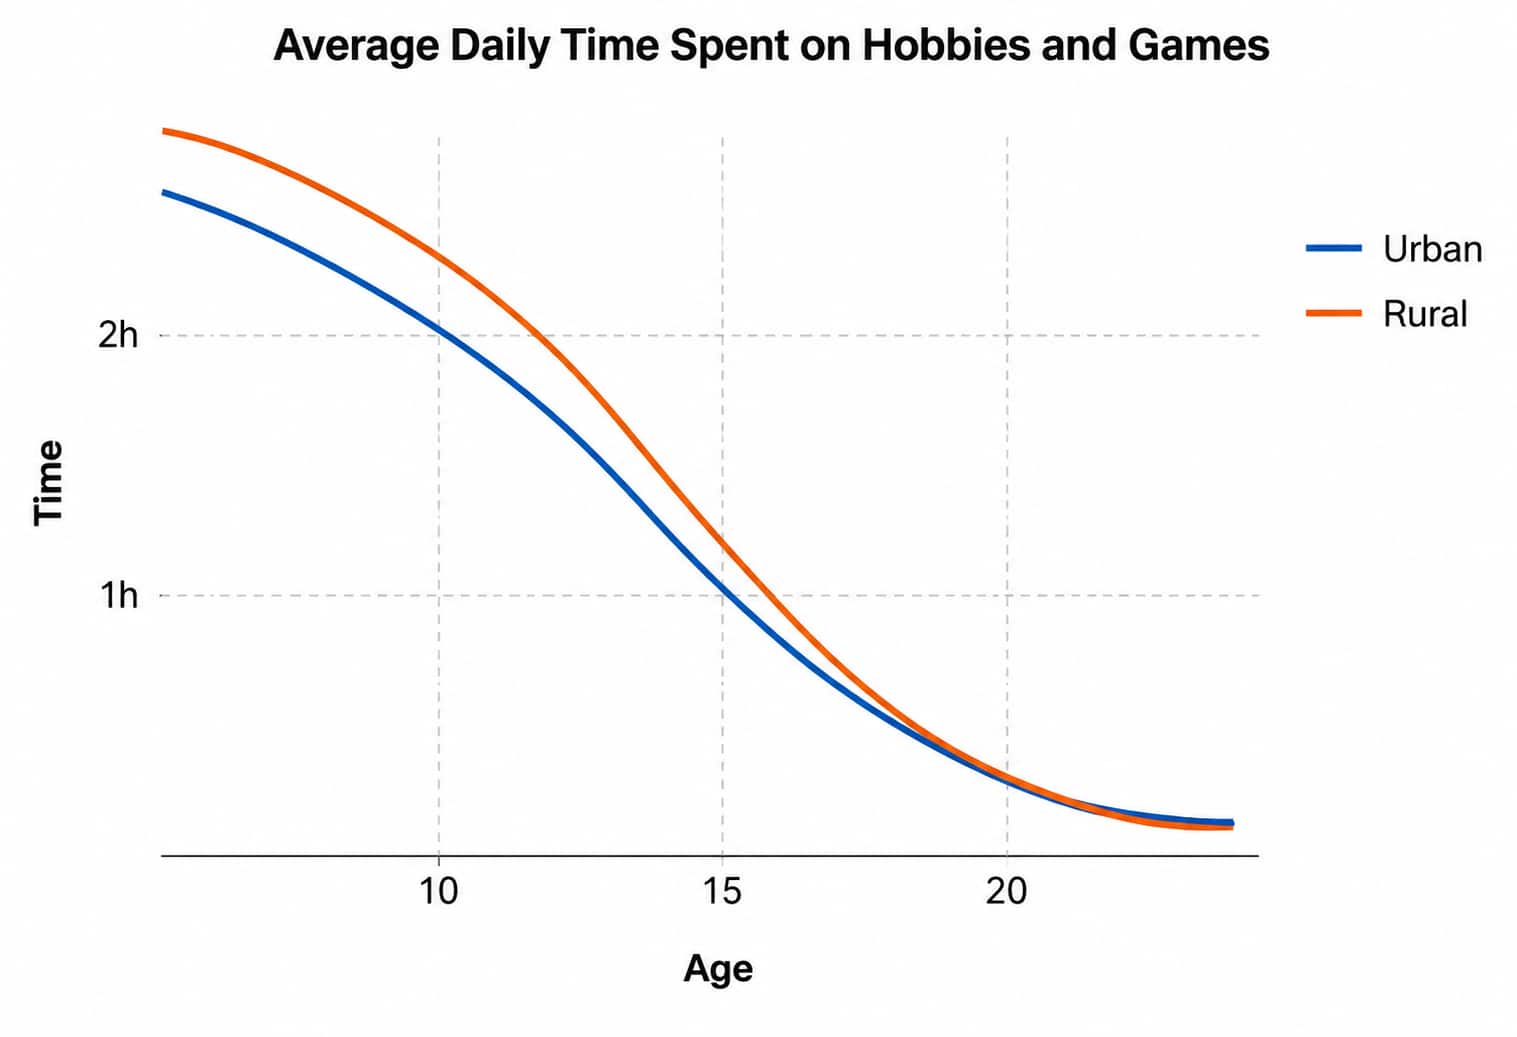
(i) How long do children aged 10 in urban areas spend each day on hobbies and games?
(ii) At what age is the average time spent daily on hobbies and games by rural kids 1.5 hours?
(a) 8 years
(b) 10 years
(c) 12 years
(d) 14 years
(e) 18 years
(iii) Are the following statements correct?
(a) The average time spent daily on hobbies and games by kids aged 15 is twice that of kids aged 10.
(b) All rural kids aged 15 spend at least 1 hour on hobbies and games everyday.

$\textbf{Answer:}$
11(i): 2 hours
$\textbf{Explanation:}$
From the graph, at age 10 years, children in urban areas spend slightly above 2 hours on hobbies and games.
11(ii): 14 years
$\textbf{Explanation:}$
From the graph, the average time spent daily on hobbies and games by rural kids reaches 1.5 hours at around 14 years.
11(iii) (a): False
$\textbf{Explanation:}$
Average time spent daily on hobbies and games by kids aged 10 = about 2 hours
Average time spent daily on hobbies and games by kids aged 15 = about 1 hour
So, the time at age 15 is half, not twice that at age 10.
11(iii) (b): False
$\textbf{Explanation:}$
The graph shows the average time spent by rural children aged 15 is around 1 hour. But an average does not mean that every child spends at least 1 hour.
Question 12. Individual project: Make your own activity strip for different days of the week.
(i) Do you eat and sleep at regular times every day? Typically how long do you spend outdoors?
(ii) Calculate the average time spent per activity. Represent this average day using a strip.
(iii) Similarly, track the activities of any adult at home. Compare your data with theirs.
$\textbf{Answer:}$
12(i):
Yes, I generally eat and sleep at regular times every day.
-
Breakfast: 7:30 am
-
Lunch: 1:30 pm
-
Dinner: 9.00 pm
-
Sleep: 10:00 pm to 6:00 am
I usually spend about 2 hours outdoors every day for games, walking, and other activities.
12(ii):
|
Activity |
Average Time per Day |
|
Sleeping |
8 hours |
|
School |
7 hours |
|
Homework & Study |
2 hours |
|
Playing Outdoors |
2 hours |
|
Meals & Personal Care |
2 hours |
|
TV/Mobile/Entertainment |
1.5 hours |
|
Family Time & Other Activities |
1.5 hours |
12(iii):
|
Activity |
Mother's Average Time |
|
Sleeping |
7 hours |
|
Work/Household Work |
9 hours |
|
Cooking & Personal Care |
3 hours |
|
Watching TV/Relaxing |
2 hours |
|
Family Time |
2 hours |
|
Outdoors/Walking |
1 hour |
Question 13. Small group project: Make a group of 3-4 members. Do at least one of the following:
(i) Track daily sleep time of all your family members for a week. Daily sleep time includes night sleep, naps, and any sleep during the day.
(a) Represent this on strips.
(b) Put together the data of all your group members. Calculate the average and median sleep time of children, adults, elderly.
(c) Share your findings and observations.
(ii) When do schools start and end? On a weekday, Manoj's school starts at 9:30 am and ends at 4:30 pm, i.e., 7 hours which include class time and breaks. Collect information on the daily timings of different schools for Grade 8, including class time and break time (the schools can be anywhere in the country. You can ask your neighbours, relatives, parents and friends to find out). Analyse and present the data collected.
$\textbf{Answer:}$
13(i):
|
Family Member |
Age Group |
Average Sleep Time per Day |
|
Riya |
Child |
9 hours |
|
Arjun |
Child |
8.5 hours |
|
Father |
Adult |
7 hours |
|
Mother |
Adult |
7.5 hours |
|
Grandmother |
Elderly |
8 hours |
Do the rest of it yourself.
(ii)
|
School |
Start Time |
End Time |
Total Duration |
|
Manoj's School |
9:30 am |
4:30 pm |
7 hours |
|
Delhi Public School |
8:00 am |
2:30 pm |
6.5 hours |
|
Kendriya Vidyalaya |
7:40 am |
1:50 pm |
6 hours 10 min |
|
St. Xavier's School |
8:30 am |
3:00 pm |
6.5 hours |
|
DAV Public School |
8:00 am |
2:00 pm |
6 hours |
Do the rest of it yourself.
Question 14. The following graphs show the sunrise and sunset times across the year at 4 locations in India. Observe how the graphs are organised. Are you able to identify which lines indicate the sunrise and which indicate the sunset?
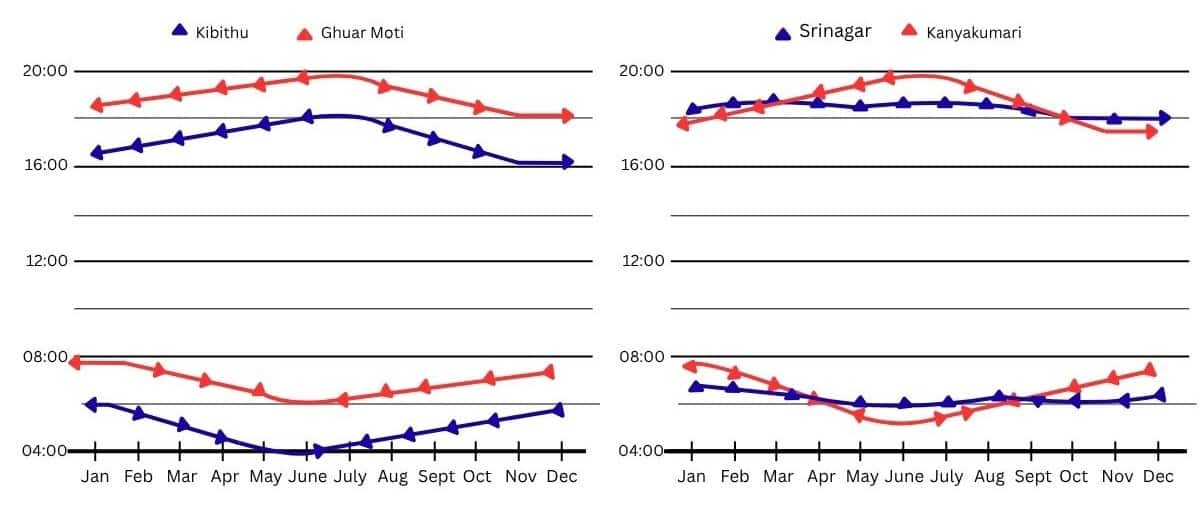
Answer the following questions based on the graphs:
(i) At which place does the sun rise the earliest in January? What is the approximate day length at this place in January?
(ii) Which place has the longest day length over the year?
(iii) Share your observations - what do you find interesting? What are you curious to find out?
$\textbf{Answer:}$
Yes, I can identify the sunrise and sunset lines from the time axes.
14 (i): At Kibithu, the sun rises almost at 6.00 AM in January, which is the earliest.
The sun sets at Kibithu at almost 16.10 PM in January.
So day length = 16.10 - 6.00 = 10 hours 10 minutes
14(ii):
From the graphs, Srinagar experiences the greatest variation and has the longest days during summer, with daylight lasting close to 15 hours around June-July.
14(iii):
Observations
-
Kibithu has the earliest sunrise among the four places.
-
Kanyakumari shows the least variation in sunrise and sunset times throughout the year.
-
Srinagar has the largest seasonal change in day length.
-
Around June–July, days are longest in northern places such as Srinagar and Kibithu.
-
Around December–January, day lengths become shorter in northern regions.
What I find interesting
-
Places within the same country can have very different sunrise and sunset timings.
-
Day length changes much more in northern India than in southern India.
What I am curious to find out
-
Why do sunrise and sunset times change with the seasons?
-
Why does Kanyakumari have nearly equal day lengths throughout the year?
Question 15. We all know the typical sunrise and sunset timings. Do you know when the moon rises and sets? Does it follow a regular pattern like the sun? Let's find out. The following graph shows the moonrise and moonset time over a month:
(i) Find out on what dates amavasya (new moon) and purnima (full moon) were in this month.
(ii) What do you notice? What do you wonder?
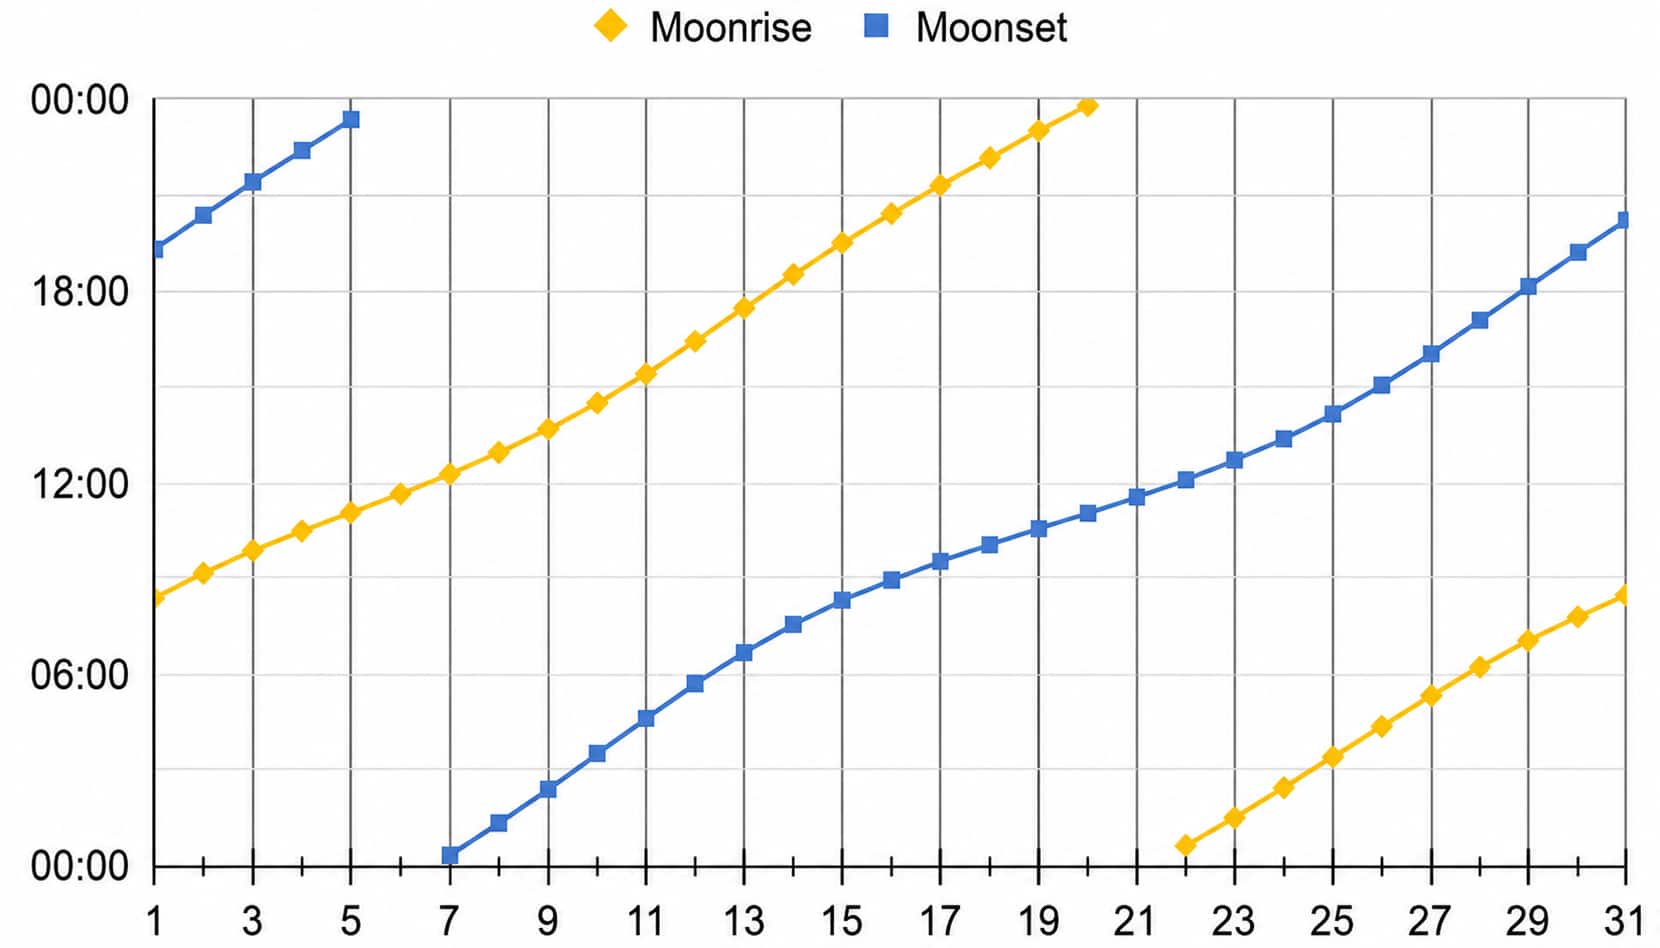
$\textbf{Answer:}$
15(i):
Amavasya (new moon): 21st Day
and Purnima (full moon): 7th day
15(ii):
Observations:
-
The difference between moonrise and moonset changes throughout the month.
-
Around the middle of the month, the gap between moonrise and moonset is the maximum.
Confused between CGPA and Percentage?
Get your results instantly with our calculator!
Key Concepts Explained in Tales by Dots and Lines - Ganita Prakash Book 2
Topics you will learn in NCERT Solutions for Class 8 Maths Part 2 Chapter 5 Tales by Dots and Lines include:
-
5.1 The Balancing Act
-
5.2 Visualising and Interpreting Data
Extra Questions for Class 8 Maths Part 2 Chapter 5 Tales by Dots and Lines
Question 1:
The average of 4 consecutive numbers is 64.5. What is the largest number among these numbers?
$\textbf{Answer:}$ 66
$\textbf{Explanation:}$
Given: The average of 4 consecutive numbers is 64.5.
Let the 4 numbers be $x$, $x+1$, $x+2$ and $x+3$, respectively.
The sum of the 4 numbers $=x+x+1+x+2+x+3=4x+6$
Use the formula, $\text{Average}=\frac{\text{Sum of all values}}{\text{Total number of values}}$
According to the question,
$\frac{4x+6}{4}=64.5$
⇒ $\frac{4x+6}{4}=64.5$
⇒ $4x+6=258$
⇒ $4x=252$
⇒ $x=63$
The largest number among these numbers = 63 + 3 = 66
Hence, the correct answer is 66.
Question 2:
The sum of 12 numbers is 1080. What is the average of these 12 numbers?
$\textbf{Answer:}$ 90
$\textbf{Explanation:}$
The sum of numbers = 1080
Total numbers = 12
Average = $\frac{\text{Sum of numbers}}{\text{Total numbers}} = \frac{1080}{12} = 90$
$\therefore$ The average of these 12 numbers is 90
Hence, the correct answer is 90.
Question 3:
The average of 10 consecutive integers is $\frac{11}{2}$. What is the average of the "smallest four" of these integers?
$\textbf{Answer:}$ 2.5
$\textbf{Explanation:}$
Let the 10 consecutive integers be $x, (x + 1), (x+2), (x+3), (x+4), (x+5), (x+6), (x+7), (x+8),(x+9)$
Average $=\frac{x+(x+1)+(x+2)+(x+3)+(x+4)+(x+5)+(x+6)+(x+7)(x+8)(x+9)}{10} = \frac{11}{2}$
⇒ $10x + 45 = \frac{11}{2} × 10$
⇒ $10x = 55 - 45$
⇒ $x = \frac{10}{10} = 1$
The Smallest four integers = $x + (x + 1) + (x+2) + (x+3)$
= 1 + 2 + 3 + 4
= 10
Average of the smallest four integers = $\frac{10}{4}$ = 2.5
Hence, the correct answer is 2.5.
Question 4:
The following line graph shows the exports by company A and company B (in crores) over the five years 2010 to 2014.
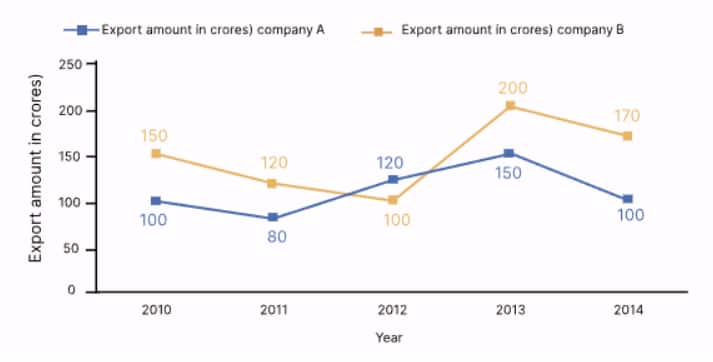
In which year, the difference between the exports from company A and company B was maximum? (Currency is Indian rupees.)
$\textbf{Answer:}$ 2014
$\textbf{Explanation:}$
From the given graph:
The difference in the year 2010 = 150 – 100 = 50
The difference in the year 2011 = 120 – 80 = 40
The difference in the year 2012 = 120 – 100 = 20
The difference in the year 2013 = 200 – 150 = 50
The difference in the year 2014 = 170 – 100 = 70
The maximum difference is seen in 2014.
Hence, the correct answer is 2014.
Question 5:
The line graph shows the production (in crores) of three companies over the years. Find the year in which total production in company Z is 30% more than that of company X
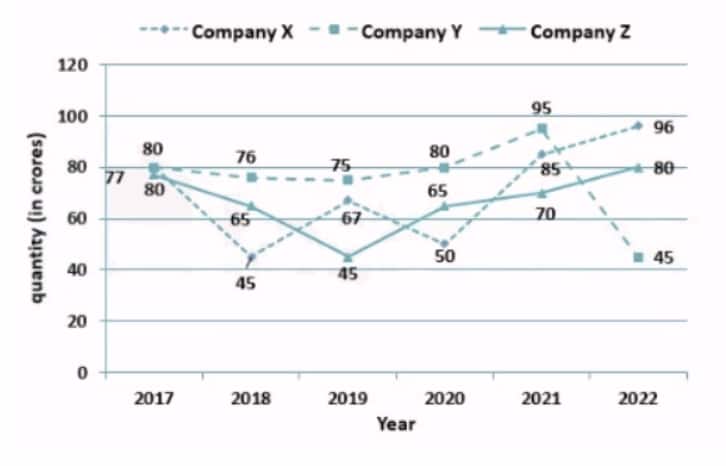
$\textbf{Answer:}$ 30%
$\textbf{Explanation:}$
In the years 2018 and 2020, the production of Z was more than that of X
Now, in 2020, total production in company Z is more than that of company X by
= $\frac{\text{Production of Z}}{\text{Production of X}}\times 100$
= $\frac{65-50}{50}\times 100$
= 30%
Hence, the correct answer is 30%.
NCERT Solutions for Class 8 Maths Chapter Wise
We at Careers360 compiled all the NCERT Class 8 Maths solutions in one place for easy student reference. The following links will allow you to access them.
NCERT Books and NCERT Syllabus
Before planning a study schedule, always analyse the latest syllabus. Here are the links to the latest NCERT syllabus and some important books that will help students in this endeavour.
Chapter Summary: NCERT Solutions for Class 8 Maths Ganita Prakash Part 2 Chapter 5
Number of Exercises: 3
Total number of questions: 28
Expert Review of NCERT Solutions for Class 8 Maths Part 2 Chapter 5
Here are the concepts and topics that are related to the latest NCERT Solutions for Class 8 Maths Ganita Prakash Part 2 Chapter 5 in higher classes.
Class 9-10
-
Data handling and interpretation
-
Line graphs and graphical representation of data
-
Arithmetic mean (average)
-
Statistics and measures of central tendency
-
Collection and organization of data
-
Frequency distribution and comparison of datasets
-
Trend analysis using graphs
-
Real-life applications of data analysis
Class 11-12
-
Data handling and interpretation
-
Line graphs and graphical representation of data
-
Arithmetic mean (average)
-
Measures of central tendency
-
Statistical analysis and data visualization
-
Coordinate geometry and graphical interpretation
-
Trends and pattern recognition in datasets
-
Applications of statistics in science and economics
JEE (Main & Advanced)
-
Statistics and data interpretation
-
Mean and measures of central tendency
-
Graphical representation of data
-
Coordinate geometry and graph analysis
-
Interpretation of trends from line graphs
-
Analytical reasoning using data
-
Problem-solving based on statistical concepts
Frequently Asked Questions (FAQs)
Visualizing data helps us understand patterns, trends, and comparisons more easily than looking at raw numbers.
A line chart is a graph that uses points connected by lines to show changes in data over time or across ordered categories.
Line charts are useful for showing trends and changes over time, such as temperature, rainfall, or population growth.
Average = (Sum of all observations) ÷ (Number of observations)
Average is used to summarise data, such as average marks, average temperature, average income, and average speed.

Popular Questions
A block of mass 0.50 kg is moving with a speed of 2.00 ms-1 on a smooth surface. It strikes another mass of 1.00 kg and then they move together as a single body. The energy loss during the collision is
| Option 1)
|
Option 2)
|
| Option 3)
|
Option 4)
|
An athlete in the olympic games covers a distance of 100 m in 10 s. His kinetic energy can be estimated to be in the range
| Option 1)
|
Option 2)
|
| Option 3)
|
Option 4)
|
A particle is projected at 600 to the horizontal with a kinetic energy . The kinetic energy at the highest point
| Option 1)
|
Option 2)
|
| Option 3)
|
Option 4)
|
In the reaction,
| Option 1)
|
Option 2)
|
| Option 3)
|
Option 4)
|
How many moles of magnesium phosphate, will contain 0.25 mole of oxygen atoms?
| Option 1)
0.02 |
Option 2)
3.125 × 10⁻² |
| Option 3)
1.25 × 10⁻² |
Option 4)
2.5 × 10⁻² |