

Statistics Class 10th Notes - Free NCERT Class 10 Maths Chapter 14 Notes - Download PDF
Statistics is a method of analysing data and converting the raw data into a more understandable form. Generally, statistics is used to compute, manipulate and organise the set of numerical data. If we have large numerical data, then statistics is the best mathematical method to summarise the data in the most representative manner. Statistics is a branch of applied mathematics. Statistics is used in many areas, such as weather forecasting, where raw numerical data is converted into useful, presentable information, and similarly in fields like psychology, geology, sociology, and probability. The real-life application of statistics is in business decision-making and sports analytics, where they compare data of different or the same sports persons.
This Story also Contains
- Class 10 Statistics Notes PDF – Download Free Study Material
- Statistics Class 10 Notes
- How to Use the Statistics Class 10 Notes Effectively?
- Statistics Class 10 Notes: Previous Year Question and Answer
- NCERT Class 10 Maths Notes – Chapter-Wise Links
These NCERT notes contain all the topics, subtopics, formulae, and important key points of statistics. These notes cover the basic definitions of statistics, what a class interval is, frequency, mean, mode and median, types of data and their related subtopics. Class 10 Statistics chapter also includes cumulative frequency and formulae. Students must practice all the topics of statistics and their examples from the NCERT Exemplar Solutions for Class 10 Maths Chapter 13 Statistics. Our Subject Matter Expert covers all the chapters in the NCERT class 10th maths notes of class 10, including all the required definitions, formulas, and examples. Check this NCERT article for complete syllabus coverage along with NCERT Books, Solutions, Syllabus, and Exemplar Problems with Solutions.
Also, read,
Class 10 Statistics Notes PDF – Download Free Study Material
Students who wish to access the Statistics Class 10 Maths notes can click on the link below to download the entire notes in PDF.
Statistics Class 10 Notes
Careers360 experts have curated these Statistics Class 10 Notes to help students revise quickly and confidently.
Statistics: Statistics is the branch of applied mathematics that is concerned with analysing, organising and presenting data more presentable and useful form.
Types of Data
There are two types of data:
1. Ungrouped Data: When data is unorganised or in the form of row data, or an observation is not classified into any group, it is called ungrouped data.
Example: The marks of the students of class 3rd out of 50.
23, 34, 43, 43, 23, 12, 10, 10, 10, 23, 45, 47, 49, 50
This type of ungrouped data is easy to work with, but only when the size of the dataset is small.
2. Grouped Data: In grouped data, data are organised, or in other words, observations are classified.
Example: The ages of different people in a city X are shown in tabulated form.
| Age Interval | No. of People |
| 0 - 20 | 12 |
| 20 - 40 | 8 |
| 40 - 60 | 24 |
| 60 - 80 | 18 |
Here, the number of people in city X is organised in different age intervals. When the large data set is in a grouped form, it is easy to work.
Frequency
The number of times a particular observation appears in the data is known as the frequency.
Class Interval
Data is divided into groups of classes according to the range in a way that all observations belong to that class, and this is called a class interval and the class width is equal for all datasets.
Class width = Upper class limit - Lower class limit
Mean
Mean is a method of determining the average of a given set of data.
Mean of Grouped Data When Class Interval Not Given:
When grouped data is given but class intervals are not given the the mean will be:
$\overline{x}$ = $\frac{\sum x_i f_i}{\sum f_i}$
Where,
$f_i$ = Frequency of the ith observation, $x_i$.
Example: The ages of the people of country X are given in tabular form. Find the mean age of the people of city X.
| Ages | 3 | 5 | 8 | 10 | 16 | 22 | 32 | 56 | 78 | 98 |
| No. of Person | 1 | 2 | 5 | 1 | 7 | 3 | 8 | 2 | 7 | 5 |
In the table, age is called $x_i$, and the number of persons is $f_i$, and we need to determine the multiplication of $ x_i$ and $ f_i$ as shown in the table.
| Ages $(x_i)$ | Numper of Persons $(f_i)$ | $f_i x_i$ |
| 3 | 1 | 3 |
| 5 | 2 | 10 |
| 8 | 5 | 40 |
| 10 | 1 | 10 |
| 16 | 7 | 112 |
| 22 | 3 | 66 |
| 32 | 8 | 256 |
| 56 | 2 | 112 |
| 78 | 7 | 546 |
| 98 | 5 | 490 |
| Total | $\sum fi = 41$ | $\sum f_i x_i = 1645$ |
$\overline{x}$ = $\frac{\sum x_i f_i}{\sum fi}$
$\overline{x}$ = $\frac{1645}{41}$
$\overline{x}$ = $40.12$
Methods of Determining the Mean of Group Data
There are three different methods to determine the mean of group data, and these methods are as follows:
1. Direct Method: In this method, convert the data into class intervals and determine the class width for each class interval and tabulate the multiplication of the class width and intervals and apply the formula of the mean.
Example: The ages of the people of country X are given in tabular form. Find the mean age of the people of city X.
| Ages | 10 - 20 | 20 - 30 | 30 - 40 | 40 - 50 | 50 - 60 | 60 - 70 | 70 - 80 | 80 - 90 | 90 - 100 |
| No. of Person | 1 | 2 | 5 | 1 | 7 | 3 | 8 | 2 | 7 |
Class width = Upper class limit - Lower class limit
| Ages | Numper of Persons $(f_i)$ | Class Mark $(x_i)$ | $f_i x_i$ |
| 10 - 20 | 1 | 15 | 15 |
| 20 - 30 | 1 | 25 | 25 |
| 30 - 40 | 5 | 35 | 175 |
| 40 - 50 | 1 | 45 | 45 |
| 50 - 60 | 7 | 55 | 385 |
| 60 - 70 | 3 | 65 | 195 |
| 70 - 80 | 8 | 75 | 600 |
| 80 - 90 | 2 | 85 | 170 |
| 90 - 100 | 7 | 95 | 665 |
| Total | $\sum f_i = 35$ | $\sum f_i x_i = 2275$ |
$\overline{x}$ = $\frac{\sum x_i f_i}{\sum f_i}$
$\overline{x}$ = $\frac{2275}{35}$
$\overline{x}$ = $65$
2. Assumed Mean Method: In this method, convert the data into class intervals and determine the class width for each class interval and determine the deviation and tabulate the multiplication of the class width and deviation and apply the formula of mean.
Deviation $(d_i)$ = $x_i - a$
Where a is the middle term in $x_i$.
| Ages | Numper of Persons $(f_i)$ | Class Mark $(x_i)$ | $d_i = x_i - 45$ | $f_i d_i$ |
| 10 - 20 | 1 | 15 | -30 | -30 |
| 20 - 30 | 1 | 25 | -20 | -20 |
| 30 - 40 | 5 | 35 | -10 | -50 |
| 40 - 50 | 1 | 45 | 0 | 0 |
| 50 - 60 | 7 | 55 | 10 | 70 |
| 60 - 70 | 3 | 65 | 20 | 60 |
| 70 - 80 | 8 | 75 | 30 | 240 |
| 80 - 90 | 2 | 85 | 40 | 80 |
| 90 - 100 | 7 | 95 | 50 | 350 |
| Total | $\sum f_i = 35$ | $\sum f_i d_i = 700$ |
$\overline{x}$ = $a + $ $\frac{\sum f_i d_i}{\sum f_i}$
$\overline{x}$ = $45 + $$\frac{700}{35}$
$\overline{x}$ = $65$
3. Step-deviation Method: As in the above example, one more step deviation method has been added in the column to find the mean, and this is as follows,
$u_i$ = $\frac{(x_i – a)}{h}$
Where,
a = The assumed mean
h = Class size or width
| Ages | Numper of Persons $(f_i)$ | Class Mark $(x_i)$ | $d_i = x_i - 45$ | $u_i$ = $\frac{(x_i – a)}{h}$, $(h = 10)$ | $f_i u_i$ |
| 10 - 20 | 1 | 15 | -30 | -3 | -3 |
| 20 - 30 | 1 | 25 | -20 | -2 | -2 |
| 30 - 40 | 5 | 35 | -10 | -1 | -5 |
| 40 - 50 | 1 | 45 | 0 | 0 | 0 |
| 50 - 60 | 7 | 55 | 10 | 1 | 7 |
| 60 - 70 | 3 | 65 | 20 | 2 | 6 |
| 70 - 80 | 8 | 75 | 30 | 3 | 24 |
| 80 - 90 | 2 | 85 | 40 | 4 | 8 |
| 90 - 100 | 7 | 95 | 50 | 5 | 35 |
| Total | $\sum f_i = 35$ | $\sum f_i u_i = 70$ |
$\overline{x}$ = $a + h$ $\frac{\sum f_i u_i}{\sum f_i}$
$\overline{x}$ = $45 + 10$ $\frac{70}{35}$
$\overline{x}$ = $45 + 10 × 2$
$\overline{x}$ = $45 + 20$
$\overline{x}$ = $65$
Relation between the Mean of Step-Deviations (u) and the Mean
$u_i$ = $\frac{(x_i - a)}{h}$
$\overline{u}$ = $\frac{(x_i - a)}{h}$
$\overline{u}$ = $\frac{\frac{\sum f_i(x_i - a)}{h}}{\sum f_i}$
$u_i$ = $\frac{1}{h} × $ $(\overline {x} - a)$
Median
Median is a method of finding the middle value for a given set of numbers. The data must be sorted in any order to determine the median of the provided dataset.
Median of Grouped Data without Class Intervals
There are three steps to determine the medium of the grouped data when no class intervals are given:
1. The first step is to arrange the data in either ascending or descending order.
2. Determine the cumulative frequency.
3. If the number of observations in the given data set is even, then the median can be calculated as,
Median = $\frac{n}{2}^{\text{th term}}$ + $(\frac{n}{2} + 1)^{\text{th term}}$
Where n = Number of observations
Example: Determine the median for the given data set.
2, 3, 1, 6, 9, 5, 8, 4
After arranging the data in ascending order, we get:
1, 2, 3, 4, 5, 6, 8, 9
Median = $\frac{(\frac{n}{2})^{\text{th term}} + (\frac{n}{2} + 1)^{\text{th term}}}{2}$
n = 8
Now, putting the values in the formulas,
Median = $\frac{(\frac{8}{2})^{\text{th term}} + (\frac{8}{2} + 1)^{\text{th term}}}{2}$
Median = $\frac{4^{\text{th term}} + 5^{\text{th term}}}{2}$
4th term = 4 and 5th term = 5
Median = $\frac{4 + 5}{2}$
Median = 4.5
4. If the number of observations in the given dataset is odd, the median can be calculated as,
Median = ($\frac{n + 1}{2})^{\text{th term}}$
Where n = Number of observations
Example: Determine the median for the given data set.
2, 3, 1, 6, 9, 5, 8
After arranging the data in ascending order, we get:
1, 2, 3, 5, 6, 8, 9
Here, n = 7
Median = ($\frac{n + 1}{2})^{\text{th term}}$
After putting in the values, we get,
Median = ($\frac{7 + 1}{2})^{\text{th term}}$
Median = $4^{\text{th term}}$
$4^{\text{th term}}$ = 5
Therefore, median = 5
Cumulative Frequency
The sum of the frequency up to a particular class interval is called the cumulative frequency.
Cumulative Frequency Distribution of Less Than Type
When the number of observations is less than or equal to the particular observation, then it is called the cumulative frequency of the less-than type.
Cumulative Frequency Distribution of More than Type
When the number of observations is greater than or equal to the particular observation, then it is called the cumulative frequency distribution of the more than type.
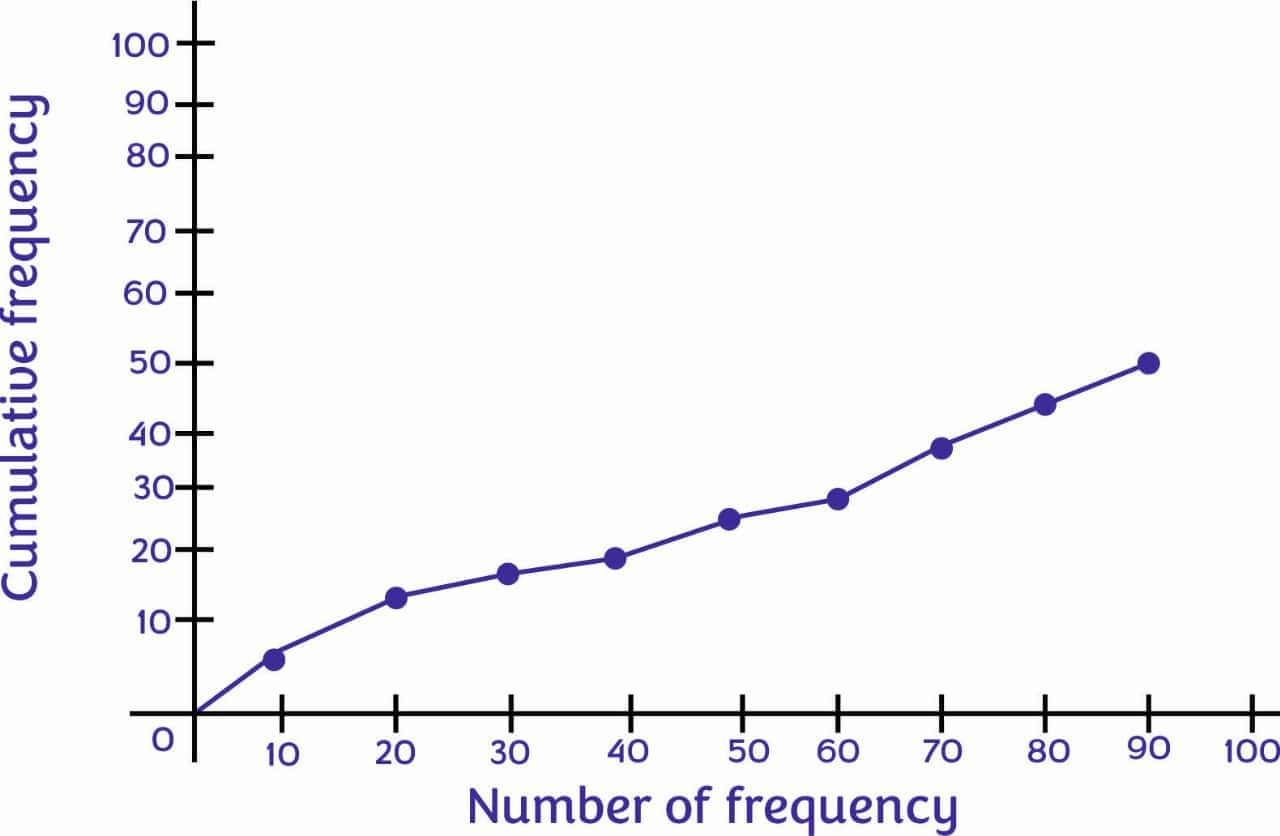
Ogive (Cumulative Frequency Graph)
This is the frequency or cumulative distribution graph of a series. It shows data values on the horizontal plane axis and the percent frequencies on the vertical axis.
Example: In the table weights of 50 boys of class X are given. Find the median weight of the class.
| Weight (in kg) | Number of boys |
| 10 - 20 | 5 |
| 20 - 30 | 6 |
| 30 - 40 | 5 |
| 40 - 50 | 3 |
| 50 - 60 | 7 |
| 60 - 70 | 3 |
| 70 - 80 | 8 |
| 80 - 90 | 6 |
| 90 - 100 | 7 |
The cumulative frequency is added to the table as shown below:
| Weight (in kg) | Number of boys (Frequency) | Cumulative Frequency |
| 10 - 20 | 5 | 5 |
| 20 - 30 | 6 | 5 + 6 = 11 |
| 30 - 40 | 5 | 11 + 5 = 16 |
| 40 - 50 | 3 | 16 + 3 = 19 |
| 50 - 60 | 7 | 19 + 7 = 26 |
| 60 - 70 | 3 | 26 = 3 = 29 |
| 70 - 80 | 8 | 29 + 8 = 37 |
| 80 - 90 | 6 | 37 + 6 = 43 |
| 90 - 100 | 7 | 43 + 7 = 50 |
The Ogive (Cumulative frequency) graph is shown below:
Median of Grouped Data with Class Intervals
The following steps are used to determine the median of grouped data sets.
1. Determine the cumulative frequency.
2. Apply the formula as:
$Median$ = $l + (\frac{ \frac{n}{2} - cf}{f}) × h$
Where,
$l$ = The lower limit of the median class
$n$ = The number of observations
$cf$ = Cummulative frequency
$f$ = Frequency of the class
$h$ = Class size
Example: In the table weights of 50 boys of class X are given. Find the median weight of the class.
| Weight (in kg) | Number of boys |
| 10 - 20 | 5 |
| 20 - 30 | 6 |
| 30 - 40 | 5 |
| 40 - 50 | 3 |
| 50 - 60 | 7 |
| 60 - 70 | 3 |
| 70 - 80 | 8 |
| 80 - 90 | 6 |
| 90 - 100 | 7 |
The cumulative frequency is added to the table as shown below:
| Weight (in kg) | Number of boys (Frequency) | Cumulative Frequency |
| 10 - 20 | 5 | 5 |
| 20 - 30 | 6 | 5 + 6 = 11 |
| 30 - 40 | 5 | 11 + 5 = 16 |
| 40 - 50 | 3 | 16 + 3 = 19 |
| 50 - 60 | 7 | 19 + 7 = 26 |
| 60 - 70 | 3 | 26 = 3 = 29 |
| 70 - 80 | 8 | 29 + 8 = 37 |
| 80 - 90 | 6 | 37 + 6 = 43 |
| 90 - 100 | 7 | 43 + 7 = 50 |
Here, n = 50
And, $\frac{50}{2}$ = 25
Therefore, the observation lies between the class intervals of 50 - 60, and this is called the median class.
Lower class limit (l) = 50
h = 10
Frequency (f) = 3
Cumulative frequency of the class preceding the median class (cf) = 19
$Median$ = $l + (\frac{ \frac{n}{2} - cf}{f}) × h$
After putting in the values, we get:
$Median$ = $50+ (\frac{ \frac{50}{2} - 19}{3}) × 10$
$Median$ = $50 + (2× 10)$
$Median$ = $70$
Mode:
The value that has the highest frequency in the given data set is called the mode.
Mode for Grouped Data with Class Intervals
The mode for grouped data with class intervals can be defined as
Mode = $l + (\frac{f_1 - f_0}{2f_1 - f_0 - f_2}) × h$
Where,
l = Lower limit of the modal class
h = Class size
f1 = Frequency of the modal class
f0 = Frequency of the class preceding the modal class
f2 = Frequency of the class succeeding the modal class
Example: In the table weights of 50 boys of class X are given. Find the mode of the given data.
| Weight (in kg) | Number of boys |
| 10 - 20 | 5 |
| 20 - 30 | 6 |
| 30 - 40 | 5 |
| 40 - 50 | 3 |
| 50 - 60 | 7 |
| 60 - 70 | 3 |
| 70 - 80 | 8 |
| 80 - 90 | 6 |
| 90 - 100 | 7 |
Mode = $l + (\frac{f_1 - f_0}{2f_1 - f_0 - f_2}) × h$
In the table, the maximum class frequency is 8, and the class interval is 70 - 80.
Therefore, the model class = 70 - 80
Lower limit of the modal class (l) = 70
Class size (h) = 10
Frequency of the modal class (f1) = 8
Frequency of the class preceding the modal class (f0) = 3
Frequency of the class succeeding the modal class (f2) = 6
After putting in the values, we get:
Mode = $70 + (\frac{8 - 3}{2 × 8 - 3 - 6}) × 10$
Mode = $70 + (\frac{5}{7}) × 10$
Mode = $70 + (\frac{50}{7})$
Mode = $77.14$
Relation Between Mean, Mode and Median
i) The mean considers all the observations, and its value lies between the extreme values. It is used to compare distributions.
ii) In a condition where all the observations are arranged in a particular form or sorted in an order where a particular observation is not important, then in this case median is required. Median does not emphasise only extreme values.
iii) If we require most most frequent values, then the mode is required. The relation between them is as follows,
3 Median = Mode + 2 Mean
Confused between CGPA and Percentage?
Get your results instantly with our calculator!
How to Use the Statistics Class 10 Notes Effectively?
Statistics is a chapter that helps us collect and understand data in a simple way using the mean, median, and mode. It is useful in everyday life whenever we compare marks, survey results, or analyse and understand large amounts of information. With the help of Class 10 Maths Chapter 13 notes, we can revise formulas and solve questions more confidently. Here are some more points on how these notes are important.
- First, learn the formulas of mean, median and mode and revise them until you remember them without looking.
- Try solving easy questions first using the notes, then slowly move to tougher ones so you don’t get confused.
- Use NCERT Class 10 Maths Chapter 13 notes while practising question sets, as it will help you check the methods step by step.
- Keep your NCERT Class 10 Maths Chapter 13 notes handy for revision in Class 11 and 12 too, as statistics continues in higher studies.
Statistics Class 10 Notes: Previous Year Question and Answer
Given below are selected previous year question answers for NCERT Class 10 Maths Chapter 13 Statistics, collected from various examinations.
Question 1:
Find the standard deviation of the following data (rounded off to two decimal places).
5, 3, 4, 7
Solution:
Standard deviation of 5, 3, 4, 7
= $\sqrt{\frac{\sum {x_i}^2}{n}-(\frac{\sum x_i}{n})^2}$
where $x_i$ are the numbers and $n$ is the count of numbers.
= $\sqrt{\frac{5^2+3^2+4^2+7^2}{4}-(\frac{5+3+4+7)}{4})^2}$
= $\sqrt{\frac{99}{4}-\frac{361}{16}}$
= $\sqrt{\frac{35}{16}}$
= 1.48
Hence, the correct answer is 1.48.
Question 2:
The median of the following data will be _________.
32, 25, 33, 27, 35, 29, and 30
Solution:
Given numbers:
32, 25, 33, 27, 35, 29, and 30
⇒ the given data is in ascending order = 25, 27, 29, 30, 32, 33, 35
The median of this data is the middlemost number of this data (as the total number of data is odd)
So, median term = $[\frac{7 + 1}{2}]^{th}$
= $[\frac{8}{2}]^{th}$
= $4^{th}$ term
⇒ Median = 30
Hence, the correct answer is 30.
Question 3:
Find the mode for the given distribution (rounded off to two decimal places).
| Class Interval | 5-10 | 10-15 | 15-20 | 20-25 | 25-30 | 30-35 |
| Frequency | 8 | 7 | 6 | 9 | 11 | 10 |
Solution:
Here, the maximum frequency is 11, and the corresponding class is 25–30.
So the modal class is 25–30.
Now the lower limit of the modal class ($l$) = 25,
Frequency of the modal class ($f_1$) = 11
Frequency of the preceding modal class ($f_0$) = 9
Frequency of the succeeding modal class ($f_2$) = 10
class size ($h$) = 5
We know, mode = $l + (\frac{f_1-f_0}{2f_1-f_0-f_2})×h$
= $25 + (\frac{11-9}{2(11)-9-10})×5$
= $25 + (\frac{2}{3})×5$
= $25 + 3.33$
= $28.33$
Hence, the correct answer is 28.33.
NCERT Class 10 Maths Notes – Chapter-Wise Links
For students' preparation, Careers360 has gathered all Class 10 Maths NCERT Notes here for quick and convenient access.
NCERT Exemplar Solutions for Class 10
Students must check the NCERT Exemplar solutions for class 10 of Mathematics and Science.
NCERT Solutions for Class 10
Students must check the NCERT solutions for class 10 of Mathematics and Science.
NCERT Books and Syllabus
To learn more about the NCERT books and syllabus, read the following articles and get a direct link to download them.
Frequently Asked Questions (FAQs)
Important topics in statistics are mean, mode, median, on grouped and ungrouped data, frequency, class intervals, and cumulative frequency.
Step-deviation method is generally used in large data sets. It simplifies calculation by using a common factor to reduce the deviations from an assumed mean and the formula is:
$ui$ = $\frac{(xi – a)}{h}$
Where,
a = The assumed mean
h = Class size or width
The formula to calculate the mode is,
Mode = $l + (\frac{f1 - f0}{2f1 - f0 - f2}) × h$
Where,
l = Lower limit of the modal class
h = Class size
f1 = Frequency of the modal class
f0 = Frequency of the class preceding the modal class
f2 = Frequency of the class succeeding the modal class
The formula for mean is $\overline{x}$ = $\frac{\sum xifi}{\sum fi}$, Where, $fi$ = Frequency of the ith observation, $xi$.
To find the mean, mode and median, calculate the midpoint of each class interval, find the cumulative frequency, and then use formulas to determine the mean, mode and median.

Popular Questions
A block of mass 0.50 kg is moving with a speed of 2.00 ms-1 on a smooth surface. It strikes another mass of 1.00 kg and then they move together as a single body. The energy loss during the collision is
| Option 1)
|
Option 2)
|
| Option 3)
|
Option 4)
|
An athlete in the olympic games covers a distance of 100 m in 10 s. His kinetic energy can be estimated to be in the range
| Option 1)
|
Option 2)
|
| Option 3)
|
Option 4)
|
A particle is projected at 600 to the horizontal with a kinetic energy . The kinetic energy at the highest point
| Option 1)
|
Option 2)
|
| Option 3)
|
Option 4)
|
In the reaction,
| Option 1)
|
Option 2)
|
| Option 3)
|
Option 4)
|
How many moles of magnesium phosphate, will contain 0.25 mole of oxygen atoms?
| Option 1)
0.02 |
Option 2)
3.125 × 10⁻² |
| Option 3)
1.25 × 10⁻² |
Option 4)
2.5 × 10⁻² |