JEE Main Important Chemistry formulas
As per latest syllabus. Chemistry formulas, equations, & laws of class 11 & 12th chapters


Every day, we make decisions based on data: whether checking cricket scores, tracking business patterns, or knowing if we need an umbrella for the day. That is the role of Statistics—it helps us arrange, interpret, and conclude based on data, especially in understanding patterns and trends. With the help of central tendencies such as mean, mode, and median, as well as data representation through graphs and distribution of frequencies, we can analyse and process the data to obtain the desired result. Probability determines the chances of the occurrence of an event. In this chapter, you will learn about the types of events, like certain events, impossible events, and sample spaces. Through the solution of the NCERT Exemplar class 10 chapter 13 on statistics and probability, you will be able to do such an analysis.
This Story also Contains
To understand this topic, students must try the Exemplar questions from NCERT, past board questions, and sample papers from previous years. The better students understand the concepts, the better they will problem-solve in an exam and in the real world. Remember to stay within the CBSE Class 10 Maths syllabus, and if you practice every day, you will build up the confidence to solve both statistics and probability.
Also, read,
| Class 10 Maths Chapter 13 Exemplar Solutions Exercise: 13.1 Page number: 157-161 Total questions: 26 |
Question 1
In the formula $\bar{x}= a+\frac{\sum f_{i}d_{i}}{\sum f_{i}}$
For finding the mean of grouped data, $d_i$’s are deviations from
(A) lower limits of the classes
(B) upper limits of the classes
(C) midpoints of the classes
(D) frequencies of the class marks
Answer: [C]
Solution. Mean: It is the average of the given numbers/observations. It is easy to calculate the mean. First of all, add up all the observations and then divide
by the total number of observations.
We know that di = xi – a
where xi is data and a is the mean
So, $d_i$ is the deviation from the midpoint of the classes.
Question 2
While computing the mean of grouped data, we assume that the frequencies are
(A) evenly distributed over all the classes
(B) centred at the class marks of the classes
(C) centred at the upper limits of the classes
(D) centred at the lower limits of the classes
Answer: [B]
Solution. Mean: It is the average of the given numbers/observations. It is easy to calculate the mean. First of all, add up all the observations and then divide by the total number of observations.
Hence, while computing the mean of grouped data, we assume that the frequencies are centered at the class marks of the classes
Question 3
If xi’s are the mid points of the class intervals of grouped data, fi’s are the corresponding frequencies and $\bar{x}$ is the mean, then $\Sigma\left(f_{i} x_{i}-\bar{x}\right)$ is equal to
(A) 0 (B) –1 (C) 1 (D) 2
Answer: [A]
Solution. Mean: It is the average of the given numbers/observations. It is easy to calculate the mean. First of all, add up all the observations and then divide by the total number of observations.
That is mean $\left ( \bar{x} \right )= \frac{\sum f_{i}x_{i}}{n}$
By cross multiplication, we get
$\sum f_{i}x_{i}= \bar{x}n\cdots (1)$
$\sum \left ( f_{i}x_{i} -\bar{x}\right )= \sum f_{i}x_{i} -\sum \bar{x}$
$=n\bar{x}-\sum \bar{x}$ (from equation (1))
$=n\bar{x}-n\bar{x}$
= 0
Question 4
In the formula $\bar{x}= a+h\left ( \frac{\sum f_{i}u_{i}}{\sum f_{i}} \right )$ for finding the mean of grouped frequency distribution, ui =
(A) $\frac{x_{i}+a}{h}$ (B) h(xi – a) (C) $\frac{x_{i}-a}{h}$ (D) $\frac{a-x_{i}}{h}$
Answer:
Answer. [C]
Solution. Mean: It is the average of the given numbers/observations. It is easy to calculate the mean. First of all, add up all the observations and then divide by the total number of observations.
Also we know that di = xi – a and $u_{i}= \frac{d_{i}}{h}$
$u_{i}= \frac{d_{i}}{h}$
put di = xi – a
$u_{i}= \frac{x_{i}-a}{h}$
Hence, option C is correct.
Question 5
The abscissa of the point of intersection of the less than type and of the more than type cumulative frequency curves of a grouped data gives its
(A) mean
(B) median
(C) mode
(D) all three above
Answer: [B]
Solution: Frequency distribution: It tells how frequencies are distributed over values in a frequency distribution. However mostly we use frequency distribution to summarize categorical variables.
If we make a graph of less than type and of more than type grouped data and find the intersection point, then the value at the abscissa is the median of the grouped data.
Hence, option (B) is correct.
Question 6
For the following distribution:
|
Class |
0-5 |
5-10 |
10-15 |
15-20 |
20-25 |
|
Frequency |
10 |
15 |
12 |
20 |
9 |
The sum of the lower limits of the median class and the modal class is
(A) 15
(B) 25
(C) 30
(D) 35
Answer: [B]
Solution: Frequency distribution: It tells how frequencies are distributed over values in a frequency distribution. However mostly we use frequency distribution to summarize categorical variables.
|
Class |
Frequency |
Cumulative Frequency (C.F) |
|
0-5 |
10 |
10 |
|
5-10 |
15 |
(10+15=25) |
|
10-15 |
12 |
(25+12=37) |
|
15-20 |
20 |
(37+20=57) |
|
20-25 |
9 |
(57+9=66) |
|
|
N=66 |
|
$\frac{N}{2}=\frac{66}{2}=33$ which ies in the class 10-15.
Hence, the median class is 10 – 15
The class with the maximum frequency is the modal class, which is 15 – 20
The lower limit of the median class = 10
The lower limit of the modal class = 15
Sum = 10 + 15 = 25
Question 7
Consider the following frequency distribution:
|
Class |
0-5 |
6-11 |
12-17 |
18-23 |
24-29 |
|
Frequency |
13 |
10 |
15 |
8 |
11 |
The upper limit of the median class is
(A) 17 ) 17.5 (C) 18 (D) 18.5
Answer: [B]
Frequency distribution: It tells how frequencies are distributed over values in a frequency distribution. However mostly we use frequency distribution to summarize categorical variables.
Class is not continuous. So we have to make 1t continuous first.
|
Class |
Frequency |
Cumulative Frequency |
|
0-5.5 |
13 |
13 |
|
5.5-11.5 |
10 |
(13+10=23) |
|
11.5-17.5 |
15 |
(23+15=38) |
|
17.5-23.5 |
8 |
(38+8=46) |
|
23.5-29.5 |
11 |
(46+11=57) |
|
|
N = 57 |
|
$\frac{N}{2}= \frac{57}{2}= 28\cdot 5$
Here, the median class is 15.5 – 17.5
The upper limit of the median class is 17.5.
Question 8
For the following distribution :
|
Marks |
Number of students |
|
Below 10 |
3 |
The modal class is
(A) 10-20 (B) 20-30 (C) 30-40 (D) 50-60
Answer:
Answer. [C]
Solution.
Frequency distribution: It tells how frequencies are distributed over values in a frequency distribution. However, mostly we use frequency distribution to summarize categorical variables.
|
Marks |
Frequency |
Cumulative Frequency |
|
0-10 |
3 |
3 |
|
10-20 |
12-3=9 |
12 |
|
20-30 |
27-12=15 |
27 |
|
30-40 |
57-27=30 |
57 |
|
40-50 |
75-57=18 |
75 |
|
50-60 |
80-75=5 |
80 |
|
|
=80 |
|
The class with the highest frequency is 30-40
Hence, 30 – 40 is the modal class.
Question 9
|
Class |
65-85 |
85-105 |
105-125 |
125-145 |
145-165 |
165-185 |
185-205 |
|
Frequency |
4 |
5 |
13 |
20 |
14 |
7 |
4 |
The difference of the upper limit of the median class and the lower limit of the modal class is
(A) 0 (B) 19 (C) 20 (D) 38
Answer: [C]
Solution: Frequency distribution: It tells how frequencies are distributed overvalues in a frequency distribution. However mostly we use frequency distribution to summarize categorical variables.
|
Class |
Frequency |
Cumulative Frequency |
|
65-85 |
4 |
4 |
|
85-105 |
5 |
(4+5=9) |
|
105-125 |
13 |
(9+13=22) |
|
125-145 |
20 |
(22+20=42) |
|
145-165 |
14 |
(42+14=56) |
|
165-185 |
7 |
(56+7=63) |
|
185-205 |
4 |
(63+4=67) |
|
|
N = 67 |
|
$\frac{N}{2}= \frac{67}{2}= 33\cdot 5$
Median class = 125 – 145
upper limit of median = 145
The class with the maximum frequency is the modal class, which is 125 – 145
lower limit of modal class = 125
Difference of the upper limit of median and lower limit of modal = 145 – 125 = 20
Question 10
The times, in seconds, taken by 150 athletes to run a 110 m hurdle race are tabulated below :
|
Class |
13.8-14 |
14-14.2 |
14.2-14.4 |
14.4-14.6 |
14.6-14.8 |
14.8-15 |
|
Frequency |
2 |
4 |
5 |
71 |
48 |
20 |
The number of athletes who completed the race in less than 14.6 seconds is :
(A) 11 (B) 71 (C) 82 (D) 130
Answer: [C]
Solution: Frequency:- The number of times an event occurs in a specific period is called frequency.
The number of athletes who are below 14.6 = frequency of class (13.8-14) + frequency of class (14- 14.2) +
frequency of class (14.2-14.4) + frequency of class (14.4-14.6)
= 2 + 4 + 5 + 71 = 82
Hence, the frequency of race completed in less than 14.6 = 82
Question 11
Consider the following distribution :
|
Marks obtained |
Number of students |
|
More than or equal to 0 |
|
The frequency of the class 30-40 is
(A) 3 (B) 4 (C) 48 (D) 51
Answer: [A]
Solution: Frequency distribution: It tells how frequencies are distributed over values in a frequency distribution. However mostly we use frequency distribution to summarize categorical variables.
|
Marks obtained |
Cumulative Frequency |
Frequency |
|
0-10 |
63 |
5 |
|
10-20 |
58 |
3 |
|
20-30 |
55 |
4 |
|
30-40 |
51 |
3 |
|
40-50 |
48 |
6 |
|
50-60 |
42 |
42 |
So, the frequency of class 30 – 40 is 3.
Question 12
If an event cannot occur, then its probability is
(A) 1 (B)$\frac{3}{4}$ (C) $\frac{1}{2}$ (D) 0
Answer. [D]
Solution: Probability; probability means possibility. It is a branch of mathematics that deals with the occurrence of a random event. The value is expressed from zero to one
Here number of favorable cases is 0.
Probability = $\frac{Number \, of\, favourable\, case}{Total\, number\, of\, cases}$
$\Rightarrow$Probability = $\frac{0}{\left ( Total\, cases \right )}= 0$
Question 13
Which of the following cannot be the probability of an event?
(A)$\frac{1}{3}$ (B) 0.1 (C) 3% (D)$\frac{17}{16}$
Answer:
Answer. [D]
Solution. Probability: probability means possibility. It is a branch of mathematics that deals with the occurrence of a random event. The value is expressed from zero to one
(A) 1/3
Here 0 < 1/3 < 1
Hence, it can be the probability of an event.
(B) 0.1
Here 0 < 0.1 < 1
Hence, it can be the probability of an event.
(C) 3% = 3/100 = 0.03
Here 0 < 0.03 < 1
Hence, it can be the probability of an event.
(D)17/16
Here $\frac{17}{16}> 1$
Hence $\frac{17}{16}$ is not a probability of event
Hence, option (D) is the correct answer.
Question 14
An event is very unlikely to happen. Its probability is closest to
(A) 0.0001 (B) 0.001 (C) 0.01 (D) 0.1
Answer:
Answer. [A]
Solution. Probability: probability means possibility. It is a branch of mathematics that deals with the occurrence of a random event. The value is expressed from zero to one.
The descending order of option (A), (B), (C), (D) is
0.1 > 0.01 > 0.001 > 0.0001 that is (D) > (C) > (B) > (A)
We can also say that it is the order of happening of an event.
Here, 0.0001 is the smallest one.
Hence, 0.0001 is very unlikely to happen
Question 15
If the probability of an event is p, the probability of its complementary event will be
(A) p – 1 (B) p (C) 1 – p (D)$1-\frac{1}{p}$
Answer:
Answer. [C]
Solution. Probability: probability means possibility. It is a branch of mathematics that deals with the occurrence of a random event. The value is expressed from zero to one.
The probability of an event = p
Let the probability of its complementary event = q
We know that total probability is equal to 1.
Hence, p + q = 1
$\Rightarrow$q = 1 – p
Question 16
The probability expressed as a percentage of a particular occurrence can never be
(A) less than 100
(B) less than 0
(C) greater than 1
(D) anything but a whole number
Answer:
Answer. [B]
Solution. Probability: probability means possibility. It is a branch of mathematics that deals with the occurrence of a random event. The value is expressed from zero to one.
The probability expressed as a percentage of an event A is between 0 to 100.
Hence, we can say that probability can never be less than 0.
Hence, option (B) is correct.
Question 17
If P(A) denotes the probability of an event A, then
(A) P(A) < 0 (B) P(A) > 1 (C) 0 ≤ P(A) ≤ 1 (D) –1 ≤ P(A) ≤ 1
Answer:
Answer. [C]
Solution. Probability: Probability means possibility. It is a branch of mathematics that deals with the occurrence of a random event. The value is expressed from zero to one.
(A) P(A) < 0
It does not represent the probability of event A because the probability of an event can never be less than 0.
(B) P(A) > 1
It does not represent the probability of event A because the probability of an event can never be greater than 1.
(C) 0 ≤ P(A) ≤ 1
It represents the probability of event A because the probability of an event always lies between 0 to 1.
(D) –1 ≤ P(A) ≤ 1
It does not represent the probability of event A because the probability of an event can never be equal to -1.
Hence, option (C) is correct.
Question 18
A card is selected from a deck of 52 cards. The probability of its being a red face card is
(A) $\frac{3}{26}$ (B) $\frac{3}{13}$ (C) $\frac{2}{13}$ (D) $\frac{1}{2}$
Answer:
Answer. [A]
Solution. Probability: Probability means possibility. It is a branch of mathematics that deals with the occurrence of a random event. The value is expressed from zero to one.
Total number of cases = 52
Red face cards = 6
Favorable cases = 6
Let event A is to selection of a card from 52 cards.
The probability that it is a red card is p(A)
$P\left ( A \right )= \frac{Number\, of\, favourable\, cases}{Total\, number\, of\, cases}$
$\Rightarrow$$P\left ( A \right )=\frac{6}{52}= \frac{3}{26}$
Question 19
The probability that a non-leap year selected at random will contain 53 Sundays is
(A) $\frac{1}{7}$ (B) $\frac{2}{7}$ (C) $\frac{3}{7}$ (D) $\frac{5}{7}$
Answer:
Answer. [A]
Solution. Probability: Probability means possibility. It is a branch of mathematics that deals with the occurrence of a random event. The value is expressed from zero to one.
In 365 days, there are 52 weeks and 1 day.
If it contains 53 Sundays, then the 1 day of the year must be Sunday.
But there are a total of 7 days.
Hence, the total number of favourable cases = 1
Hence probability of 53 sunday = $\frac{Number\, of\, favourable\, cases}{Total\, cases}$
$= \frac{1}{7}$
Question 20
When a die is thrown, the probability of getting an odd number less than 3 is
(A) $\frac{1}{6}$ (B) $\frac{1}{3}$ (C) $\frac{1}{2}$ (D) 0
Answer:
Answer. [A]
Solution. Probability: Probability means possibility. It is a branch of mathematics that deals with the occurrence of a random event. The value is expressed from zero to one.
Total no. of cases = 6
odd number less than 3 = 1
Number of favorable cases = 1
Probability = $= \frac{1}{6}$
Question 21
A card is drawn from a deck of 52 cards. The event E is that the card is not an ace of hearts. The number of outcomes favourable to E is
(A) 4 (B) 13 (C) 48 (D) 51
Answer:
Answer. [D]
Solution. Total number of cards = 52
Ace of hearts = 1
The card is not an ace of hearts = 52 – 1 = 51
The number of outcomes favourable to E = 51
Question 22
The probability of getting a bad egg in a lot of 400 is 0.035. The number of bad eggs in the lot is
(A) 7 (B) 14 (C) 21 (D) 28
Answer:
Answer. [B]
Solution. Probability: Probability means possibility. It is a branch of mathematics that deals with the occurrence of a random event. The value is expressed from zero to one.
Let event A be to get a bad egg.
So, p (A) = 0.035 (given)
P(A) = $\frac{Number\, of\, favorable\ cases }{Total\, number\, of\, cases}$
$\Rightarrow$0.035 = $\frac{Number\, of\, favorable\ cases }{400}$
Number of favourable cases = $\frac{35}{1000}\times 400= \frac{140}{10}= 14$
Question 23
A girl calculates that the probability of her winning the first prize in a lottery is 0.08. If 6000 tickets are sold, how many tickets has she bought?
(A) 40 (B) 240 (C) 480 (D) 750
Answer:
Answer. [C]
Solution. Probability: Probability means possibility. It is a branch of mathematics that deals with the occurrence of a random event. The value is expressed from zero to one.
Total cases = 6000
Probability of getting first prize (p(A)) = 0.08
p(A) $= \frac{Number\, of\, tickets\, the\, bought}{Total\, tickets}$
$\Rightarrow$0.08 × 6000 = Number of tickets the bought
Number of tickets they bought = 480.
Question 24
One ticket is drawn at random from a bag containing tickets numbered 1 to 40. The probability that the selected ticket has a number which is a multiple of 5 is
(A) $\frac{1}{5}$ (B) $\frac{3}{5}$ (C) $\frac{4}{5}$ (D) $\frac{1}{3}$
Answer:
Answer. [A]
Solution. Probability: Probability means possibility. It is a branch of mathematics that deals with the occurrence of a random event. The value is expressed from zero to one.
Total tickets = 40
Number of tickets multiple of 5 = 5, 10, 15, 20, 25, 30, 35, 40
Total favourable cases = 8
Let A be the event of getting a ticket with a number multiple of 5.
p(A) = $\frac{Number\, of\, tickets\, the\, bought}{Total\, tickets}$
$\Rightarrow$$p\left ( A \right )= \frac{8}{40}= \frac{1}{5}$
Question 25
Someone is asked to take a number from 1 to 100. The probability that it is a prime is
(A) $\frac{1}{5}$ (B) $\frac{6}{25}$ (C) $\frac{1}{4}$ (D) $\frac{13}{50}$
Answer:
Answer. [C]
Solution. Probability: Probability means possibility. It is a branch of mathematics that deals with the occurrence of a random event. The value is expressed from zero to one.
Total number of cases = 100
prime number from 1 to 100 = 2, 3, 5, 7, 9, 11, 13, 17, 19,
23, 29, 31, 37, 41, 43, 47, 53, 59, 61, 67, 71, 73, 83, 89, 97
Total prime numbers from 1 to 100 = 25
Probability of getting prime number = $\frac{prime\, no.\, from\, 1\, to\, 100}{Total\, number}$
$\\=\frac{25}{100}\\\\=\frac{1}{4}$
Question 26
A school has five houses: A, B, C, D, and E. A class has 23 students, 4 from house A, 8 from house B, 5 from house C, 2 from house D, and the rest from house E. A single student is selected at random to be the class monitor. The probability that the selected student is not from A, B, and C is
(A) $\frac{4}{23}$ (B) $\frac{6}{23}$ (C) $\frac{8}{23}$ (D) $\frac{17}{23}$
Answer:
Answer. [B]
Solution. Probability: Probability means possibility. It is a branch of mathematics that deals with the occurrence of a random event. The value is expressed from zero to one.
Total students = 23
Students in A, B, C = 4 + 8 + 5 = 17
Students in C, D = 23 – 17 = 6
Number of favourable cases = 6
Let A be the event that the student is not from A, B, C
$p\left ( A \right )= \frac{Student\, from\, C,D}{Total\, students}$
$\Rightarrow$$p\left ( A \right )= \frac{6}{23}$
| Class 10 Maths Chapter 13 Exemplar Solutions Exercise: 13.2 Page number: 161-163 Total questions: 14 |
Question 1
Answer:
Answer. [False]
Solution. Grouped data are data formed by aggregating individual observations of a variable into groups.
Ungrouped data:- The data that is not grouped is called ungrouped data.
The median is the middle number in the grouped data, but when the data is ungrouped, the median is also changed.
Hence, the median is not the same for grouped and ungrouped data
Question 2
Answer:
Answer. [False]
Solution. Grouped data are data formed by aggregating individual observations of a variable into groups.
Mean: It is the average of the given numbers. It is easy
to calculate the mean. First of all, add up all the numbers, then divide by how many numbers there are.
This last statement is not correct because a can be any point in the grouped data; it is not necessary that a must be the midpoint.
Hence, the statement is false.
Question 3
Answer:
Answer. [False]
Solution. Mean: It is the average of the given numbers. It is easy to calculate the mean. First of all, add up all the numbers, then divide by how many numbers are there.
Grouped data are data formed by aggregating individual observations of a variable into groups.
The mean, mode, and median of grouped data can be the same it will depend on what type of data is given.
Hence, the statement is false.
Question 4
Will the median class and modal class of grouped data always be different? Justify your answer.
Answer:
Answer. [False]
Solution. Grouped data are data formed by aggregating individual observations of a variable into groups.
The median is always the middle number, and the modal class is the class with the highest frequency it can happen that the median class is of the highest frequency.
So the given statement is false, the median class and mode class can be the same.
Question 5
Answer:
Answer. [False]
Solution. Probability: Probability means possibility. It is a branch of mathematics that deals with the occurrence of a random event. The value is expressed from zero to one.
Total children = 3
Cases – GGG, GGB, GBG, BGG, BBB, BBG, BGB, GBB were G is girl and B is boy.
Probability = $\frac{Number\, of\, favorable\ cases, }{Total\, number\, of\, cases}$
Probability of 0 girl = $\frac{1}{8}$
Probability of 1 girl = $\frac{3}{8}$
Probability of 2 girl = $\frac{3}{8}$
Probability of 3 girl = $\frac{1}{8}$
Here they are not equal to $\frac{1}{4}$
Question 6
Answer:
Answer. [False]
Solution. Probability: Probability means possibility. It is a branch of mathematics that deals with the occurrence of a random event. The value is expressed from zero to one.
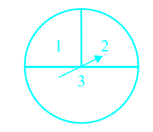
Here, 3 contains 50% of the region, and 1, 2 contain 25%, 15% of the region.
Probability= $\frac{Number\, of\, favorable\ cases }{Total\, number\, of\, cases}$
Probability of 3= $\frac{50}{100}= \frac{1}{2}$
Probability of 1= $\frac{25}{100}= \frac{1}{4}$
probability of 2= $\frac{25}{100}= \frac{1}{4}$
All probabilities are not equal. So the given statement is false.
Question 7
Answer:
Answer. [Peehu]
Solution. Probability: Probability means possibility. It is a branch of mathematics that deals with the occurrence of a random event. The value is expressed from zero to one.
As Apoorv throws two dice total cases = 36
Product is 36 when he get = (6, 6)
Number of favourable cases = 1
Probability = $\frac{Number\, of\, favourable\ cases }{Total\, number\, of\, cases}$
Probability that Apoorv get 36 = $\frac{1}{36}$
Peehu throws are die total cases = 6
The square of 6 is 36
Hence case = 1
Probability that Peehu get 36 = $\frac{1}{6}$
Hence, Peehu has better cases to get 36.
Question 8
Answer:
Answer. [True]
Solution. Probability: Probability means possibility. It is a branch of mathematics that deals with the occurrence of a random event. The value is expressed from zero to one.
Total cases when we toss a coin = 2(H, T)
Probability = $\frac{Number\, of\, favourable\ cases, }{Total\, number\, of\, cases}$
Probability of head = $\frac{1}{2}$
Probability of tail = $\frac{1}{2}$
Hence, the probability of each outcome is $\frac{1}{2}$.
Question 9
Answer:
Answer. [False]
Solution. Probability: Probability means possibility. It is a branch of mathematics that deals with the occurrence of a random event. The value is expressed from zero to one.
Here total cases = 6
Number of favourable cases in getting 1 = 1
Probability = $\frac{Number\, of\, favourable\ cases, }{Total\, number\, of\, cases}$
Probability of getting $1= \frac{1}{6}$
Number of favourable cases 'not 1' = 5 (2, 3, 4, 5, 6)
Probability of not 1 = $\frac{5}{6}$
Hence, they are not equal to $\frac{1}{2}$
Question 10
Answer:
Answer. [$\frac{1}{8}$ ]
Solution. Probability: Probability means possibility. It is a branch of mathematics that deals with the occurrence of a random event. The value is expressed from zero to one.
Total cases in tossing three coins = 8(HHH, HHT, HTH, THH, TTT, TTH, THT, HTT)
Number of cases with no head = TTT
Probability = $\frac{Number\, of\, favourable\ cases }{Total\, number\, of\, cases}$
Probability of no head =$\frac{1}{8}$
The conclusion that the probability of no head is $\frac{1}{4}$ is wrong because, as we calculated above, it comes out to $\frac{1}{8}$. Hence the probability of no head is $\frac{1}{8}$
Question 11
Answer:
Answer. [False]
Solution. Probability: Probability means possibility. It is a branch of mathematics that deals with the occurrence of a random event. The value is expressed from zero to one.
The probability of getting a head is 1, which means that we never get a tail. But this is not true because we have both heads and tails on a coin. Hence probability of getting a head is 1 is false.
Question 12
Answer:
Answer. [False]
Solution. Probability: Probability means possibility. It is a branch of mathematics that deals with the occurrence of a random event. The value is expressed from zero to one.
No, because when we toss a coin, we can get either tail or head, and the probability of each is $\frac{1}{2}$.
So, it is not necessary that she gets tails on the fourth toss. She can also get a head.
Question 13
Answer:
Answer. [False]
Solution. Probability: Probability means possibility. It is a branch of mathematics that deals with the occurrence of a random event. The value is expressed from zero to one.
No, because we get head or tail after tossing a coin, the probability of both outcomes is $\frac{1}{2}$ .
Hence tail does not have a higher chance than the head.
Both have an equal chance.
Question 14
Answer:
Answer. [True]
Solution. Probability: Probability means possibility. It is a branch of mathematics that deals with the occurrence of a random event. The value is expressed from zero to one.
Total slips = 100
Slips with an even number = 50
Probability = $\frac{Number\, of\, favourable\ cases }{Total\, number\, of\, cases}$
Probability of slip with even number = $\frac{50}{100}= \frac{1}{2}$
Slips with odd number = 50
Probability of slip with odd number = $\frac{50}{100}= \frac{1}{2}$
Hence, the probability of each is $\frac{1}{2}$.
| Class 10 Maths Chapter 13 Exemplar Solutions Exercise: 13.3 Page number: 166-174 Total questions: 42 |
Question 1
Find the mean of the distribution:
|
Class |
1-3 |
3-5 |
5-7 |
7-10 |
|
Frequency |
9 |
22 |
27 |
17 |
Answer:
Answer. [5.5]
Solution. Here we calculate the mean by following the given steps:
Find the midpoint of each interval.
Multiply the frequency of each interval by its midpoint.
Get the sum of all the frequencies (f) and sum of all the (fx)
Now divide the sum of (fx) by the sum of (f)
|
Class |
Marks (xi) |
Frequency(fi) |
fixi |
|
1-3 |
2 |
9 |
18 |
|
3-5 |
4 |
22 |
88 |
|
5-7 |
6 |
27 |
162 |
|
7-10 |
8.5 |
17 |
144.5 |
|
|
|
$\sum f_{i}= 75$ |
$\sum f_{i}x_{i}= 412\cdot 5$ |
$mean\left ( \bar{x} \right )= \frac{\sum f_{i}x_{i}}{\sum f_{i}}= \frac{412\cdot 5}{75}= 5\cdot 5$
Question 2
Calculate the mean of the scores of 20 students in a mathematics test :
|
Marks |
10-20 |
20-30 |
30-40 |
40-50 |
50-60 |
|
Number of students |
2 |
4 |
7 |
6 |
1 |
Answer:
Answer. [35]
Solution. Here we calculate the mean by following the given steps:
Find the midpoint of each interval.
Multiply the frequency of each interval by its midpoint.
Get the sum of all the frequencies (f) and the sum of all the (fx)
4 Now divide the sum of (fx) by the sum of (f)
|
Marks |
xi |
No.of students fi |
fixi |
|
10-20 |
15 |
2 |
30 |
|
20-30 |
25 |
4 |
100 |
|
30-40 |
35 |
7 |
245 |
|
40-50 |
45 |
6 |
270 |
|
50-60 |
55 |
1 |
55 |
$\sum f_{i}= 20$ $\sum f_{i}x_{i}= 700$
$mean\left ( \bar{x} \right )= \frac{\sum f_{i}x_{i}}{\sum f_{i}}= \frac{700}{20}= 35$
Question 3
Calculate the mean of the following data
|
Class |
4-7 |
8-11 |
12-15 |
16-19 |
|
Frequency |
5 |
4 |
9 |
10 |
Answer:
Answer. [12.93]
Solution. Here we calculate the mean by following the given steps:
Find the midpoint of each interval.
Multiply the frequency of each interval by its midpoint.
Get the sum of all the frequencies (f) and the sum of all the (fx)
Now divide the sum of (fx) by the sum of (f)
|
Class |
xi |
fi |
fi xi |
|
4-7 |
5.5 |
5 |
275 |
|
8-11 |
9.5 |
4 |
38 |
|
12-15 |
13.5 |
9 |
121.5 |
|
16-19 |
17.5 |
10 |
175 |
|
|
|
$\sum f_{i}= 28$ |
$\sum f_{i}x_{i}= 362$ |
$mean\left ( \bar{x} \right )= \frac{\sum f_{i}x_{i}}{\sum f_{i}}= \frac{362}{28}= 12\cdot 93$
Question 4
|
no.of pages written per day |
16-18 |
19-21 |
22-24 |
25-27 |
28-30 |
|
no.of days |
1 |
3 |
4 |
9 |
13 |
Find the mean number of pages written per day.
Answer:
Answer. [26]
Solution. Here we calculate the mean by following the given steps:
Find the midpoint of each interval.
Multiply the frequency of each interval by its midpoint.
Get the sum of all the frequencies (f) and sthe um of all the (fx)
Now divide the sum of (fx) by the sum of (f)
|
No.of pages written per day |
no.of days(fi) |
(xi) |
fixi |
|
16-18 |
1 |
17 |
17 |
|
19-21 |
3 |
20 |
60 |
|
22-24 |
4 |
23 |
92 |
|
25-27 |
9 |
26 |
234 |
|
28-30 |
13 |
29 |
377 |
|
|
$\sum f_{i}= 30$ |
|
$\sum f_{i}x_{i}= 780$ |
$mean\left ( \bar{x} \right )= \frac{\sum f_{i}x_{i}}{\sum f_{i}}= \frac{780}{30}= 26$
Question 5
The daily income of a sample of 50 employees are tabulated as follows :
|
Income (in Rs) |
1-200 |
201-400 |
401-600 |
601-800 |
|
Number of employees |
14 |
14 |
14 |
7 |
Find the mean daily income of employees.
Answer:
Answer. [356.5]
Solution. Here we calculate the mean by following the given steps:
Find the midpoint of each interval.
Multiply the frequency of each interval by its midpoint.
Get the sum of all the frequencies (f) and the sum of all the (fx)
Now divide the sum of (fx) by the sum of (f)
|
Income (in Rs ) |
xi |
No.of employees |
fixi | |
|
1-200 |
100.5 |
14 |
1407 | |
|
201-400 |
300.5 |
15 |
4507.5 | |
|
401-600 |
500.5 |
14 |
7007 | |
|
601-800 |
700.5 |
7 |
4903.5 | |
|
|
|
|
$\sum f_{i}x_{i}= 17825$ |
$mean\left ( \bar{x} \right )= \frac{\sum f_{i}x_{i}}{\sum f_{i}}= \frac{17825}{50}= 356.5$
Question 6
|
no.of seats |
100-104 |
104-108 |
108-112 |
112-116 |
116-120 |
|
Frequency |
15 |
20 |
32 |
18 |
15 |
Determine the mean number of seats occupied over the flights.
Answer:
Answer. [109]
Solution. Here we calculate the mean by following the given steps:
Find the midpoint of each interval.
Multiply the frequency of each interval by its midpoint.
Get the sum of all the frequencies (f) and the sum of all the (fx)
Now divide the sum of (fx) by the sum of (f)
|
Number of seats |
Frequency fi |
xi |
fixi |
|
100-104 |
15 |
102 |
1530 |
|
104-108 |
20 |
106 |
2120 |
|
108-112 |
32 |
110 |
3520 |
|
112-116 |
18 |
114 |
2052 |
|
116-120 |
15 |
118 |
177065268 |
|
|
$\sum f_{i}= 100$ |
|
$\sum f_{i}x_{i}= 10992$ |
$mean\left ( \bar{x} \right )= \frac{\sum f_{i}x_{i}}{\sum f_{i}}= \frac{10992}{100}= 109\cdot 92$
number of seats = 109
Question 7
The weights (in kg) of 50 wrestlers are recorded in the following table :
|
Weight (in Kg) |
100-110 |
110-120 |
120-130 |
130-140 |
140-150 |
|
Number of wrestlers |
4 |
14 |
21 |
8 |
3 |
Find the mean weight of the wrestlers.
Answer:
Answer. [123.4]
Solution. Here we calculate the mean by following the given steps:
Find the midpoint of each interval.
Multiply the frequency of each interval by its midpoint.
Get the sum of all the frequencies (f) and the sum of all the (fx)
Now divide the sum of (fx) by the sum of (f)
|
Weight |
fi |
xi |
fixi |
|
100-110 |
4 |
105 |
420 |
|
110-120 |
14 |
115 |
1610 |
|
120-130 |
21 |
125 |
2625 |
|
130-140 |
8 |
135 |
1080 |
|
140-150 |
3 |
145 |
435 |
|
|
$\sum f_{i}= 50$ |
|
$\sum f_{i}x_{i}=6170$ |
$mean\left ( \bar{x} \right )= \frac{\sum f_{i}x_{i}}{\sum f_{i}}= \frac{6170}{50}= 123\cdot 4 \ \ kg$
Question 8
|
Mileage (km/I) |
10-20 |
12-14 |
14-16 |
16-18 |
|
Number of cars |
7 |
12 |
18 |
13 |
Find the mean mileage.
The manufacturer claimed that the mileage of the model was 16 km/litre. Do you agree with this claim?
Answer:
Answer. [14.48]
Solution. Here we calculate the mean by following
1. Find the midpoint of each interval.
2. Multiply the frequency of each interval by its midpoint.
3. Get the sum of all the frequencies (f) and the sum of all the (fx)
4. Now divide the sum of (fx) by the sum of (f)
|
MIleage (km/I) |
No.of cars (fi) |
xi |
fixi |
|
10-12 |
7 |
11 |
77 |
|
12-14 |
12 |
13 |
156 |
|
14-16 |
18 |
15 |
270 |
|
16-18 |
13 |
17 |
221 |
|
|
$\sum f_{i}= 50$ |
|
$\sum f_{i}x_{i}= 724$ |
$mean\left ( \bar{x} \right )= \frac{\sum f_{i}x_{i}}{\sum f_{i}}= \frac{724}{50}= 14\cdot 48 \ \ km/L$
Question 9
The following is the distribution of weights (in kg) of 40 persons :
|
Weight (in kg) |
40-45 |
45-50 |
50-55 |
55-60 |
60-65 |
65-70 |
70-75 |
70-75 |
|
Number of person |
4 |
4 |
13 |
5 |
6 |
5 |
2 |
1 |
Construct a cumulative frequency distribution (of the less than type) table for the data above.
Answer:
Solution. Frequency distribution: It tells how frequencies are distributed over values in a frequency distribution. However, mostly we use frequency distribution to summarize categorical variables.
|
CI. |
f |
cf |
|
40-45 |
4 |
4 |
|
45-50 |
4 |
8 |
|
50-55 |
13 |
21 |
|
55-60 |
5 |
26 |
|
60-65 |
6 |
32 |
|
65-70 |
5 |
37 |
|
70-75 |
2 |
39 |
|
75-80 |
1 |
40 |
Question 10
|
Marks |
Number of students |
|
Below 10 |
10 |
Construct a frequency distribution table for the data above.
Answer:
Solution. Frequency distribution: It tells how frequencies are distributed over values in a
frequency distribution. However mostly we use frequency distribution to summarize categorical variables.
|
Marks |
cf |
f |
|
0-10 |
10 |
10 |
|
10-20 |
50 |
50-10=40 |
|
20-30 |
130 |
130-50=80 |
|
30-40 |
270 |
270-130=140 |
|
40-50 |
440 |
440-270=170 |
|
50-60 |
570 |
570-440=130 |
|
60-70 |
670 |
670-570=100 |
|
70-80 |
740 |
740-670=70 |
|
80-90 |
780 |
780-740=40 |
|
90-100 |
800 |
800-780=20 |
Question 11
Form the frequency distribution table from the following data :
|
Marks (out of 90) |
Number of candidates |
|
More than or equal to 80 |
4 |
Answer:
Solution. Frequency distribution: It tells how frequencies are distributed over values in a frequency distribution. However mostly we use frequency distribution to summarize categorical variables.
|
class |
f |
|
0-10 |
34-32=2 |
|
10-20 |
32-30=2 |
|
20-30 |
30-27=3 |
|
30-40 |
27-23=4 |
|
40-50 |
23-17=6 |
|
50-60 |
17-11=6 |
|
60-70 |
11-6=5 |
|
70-80 |
6-4-=2 |
|
80-90 |
4 |
Question 12
|
Height (in cm) |
Frequency |
Cumulative frequency |
|
150-155 |
12 |
a |
|
Total |
50 |
|
Answer:
Solution. Frequency distribution: It tells how frequencies are distributed overvalues in a frequency distribution. However mostly we use frequency distribution to
summarize categorical variables.
$a= 12$ ( because first term of frequency and cumulative frequency is same )
$\Rightarrow$12 + b = 25
$\Rightarrow$b = 25 – 12
$\Rightarrow$b = 13
$\Rightarrow$25 + 10 = c
$\Rightarrow$35= c
$\Rightarrow$c + d = 43
$\Rightarrow$35 + d = 43
$\Rightarrow$d = 43 – 35
$\Rightarrow$d=8
$\Rightarrow$43 + e = 48
$\Rightarrow$e = 48 – 43
$\Rightarrow$e =5
$\Rightarrow$48+2 = f
$\Rightarrow$50 = f
Ans. a = 12, b = 13, c = 35, d = 8, e = 5, f = 50
Question 13
|
Age (in yeras) |
10-20 |
20-30 |
30-40 |
40-50 |
50-60 |
60-70 |
|
Number of patients |
60 |
42 |
55 |
70 |
53 |
20 |
(i) Less than type cumulative frequency distribution.
(ii) More than type cumulative frequency distribution
Answer:
Solution. Frequency distribution: It tells how frequencies are distributed overvalues in a frequency distribution. However mostly we use frequency distribution to summarize categorical variables.
|
Age (in year) |
No.of patients |
|
less than 10 |
0 |
|
less than 20 |
60+0 = 60 |
|
less than 30 |
42+60 = 102 |
|
less than 40 |
102+55 =157 |
|
less than 50 |
157+70 = 227 |
|
less than 60 |
227+53 =280 |
|
less than 70 |
280 +20 =300 |
|
Age (in year) |
No.of patients |
|
More than or equal to 10 |
60+42+55+70+53+20 = 300 |
Question 14
|
Marks |
Below 20 |
Below 40 |
Below 60 |
Below 80 |
Below 100 |
|
Number of students |
17 |
22 |
29 |
37 |
50 |
Form the frequency distribution table for the data
Answer:
Solution. Frequency distribution: It tells how frequencies are distributed overvalues in a frequency distribution. However mostly we use frequency distribution to summarize categorical variables.
|
Marks |
Number of students CF |
f |
|
0- 20 |
17 |
17 |
|
20- 40 |
22 |
22-17 = 5 |
|
40- 60 |
29 |
29 -22 = 7 |
|
60- 80 |
37 |
37-29 = 8 |
|
80-100 |
50 |
50 -37 = 13 |
Question 15
Weekly income of 600 families is tabulated below :
|
Weekly income (in Rs) |
Number of families |
|
0-1000 |
250 |
|
Total |
600 |
Compute the median income.
Answer:
Answer. [1263.15]
Solution. n = 600
$\frac{n}{2}= \frac{600}{2}= 300$
$\iota$= 1000, l = 1000, cf = 250, f = 190
median = $\iota +\left ( \frac{\frac{n}{2}-cf}{f} \right )\times h$
$= 1000+\frac{\left ( 300-250 \right )}{190}\times 1000$
$= 1000+\frac{50}{190}\times 1000$
$= 1000+\frac{5000}{19}$
$= \frac{19000+5000}{19}= \frac{24000}{19}= 1263\cdot 15$
Median = 1263.15
Question 16
|
Speed (km/h) |
85-100 |
100-115 |
115-130 |
130-145 |
|
Number of players |
11 |
9 |
8 |
5 |
Calculate the median bowling speed.
Answer:
Answer. [109.16]
Solution. Here n = 33
$\frac{n}{2}= \frac{33}{2}= 16\cdot 5$
$\iota = 100$
h = 15, f = 9 , cf = 11
Median $= \iota +\left ( \frac{\frac{n}{2}-cf}{f} \right )\times h$
$=100+\frac{\left ( 16\cdot 5-11 \right )\times 15}{9}$
$=100+\left ( \frac{55}{10\times 9} \right )\times 15$
$=100+\frac{55\times 5}{30}$
$=100+\frac{275}{30}$
=100 + 9.16 $\Rightarrow$ 109.16
Question 17
The monthly income of 100 families are given as below :
|
Income (in Rs) |
Number of families |
|
0-5000 |
8 |
Calculate the modal income.
Answer:
Answer. [11875]
Solution. Here l = 10000, f1 = 41, f0 = 26, f2 = 16, h = 5000
Mode = $\iota +\left ( \frac{f_{1}-f_{0}}{2f_{1}-f_{0}-f_{2}} \right )\times h$
=$1000+\left ( \frac{41-26}{2\times 41-26-16} \right )\times 5000$
=$1000+\frac{15}{40}\times 5000$
= 10000 + 1875 = 11875
Modal income is 11875 Rs.
Question 18
The weight of coffee in 70 packets are shown in the following table :
|
Weight (in g) |
Number of packets |
|
200-201 |
12 |
Determine the modal weight.
Answer:
Answer. [201.7 g]
Solution.
Here l = 201, f1 = 26, f0 = 12, f2 = 20, h = 1
$\Rightarrow 201+\left ( \frac{26-12}{2\times 26-12-20} \right )\times 1$
$\Rightarrow 201+\left ( \frac{14}{52-32} \right )$
$\Rightarrow 201+\frac{14}{20}$
$\Rightarrow 201+0\cdot 7= 201\cdot 7 g$
Question 19
Answer:
Solution. Probability ; probability means possibility. It is a branch of mathematics that deals with the occurrence of a random event. The value is expressed from zero to one
Total number of cases after thrown of two dice = 36
(i) Same number = (1, 1), (2, 2), (3, 3), (4. 4), (5, 5), (6, 6)
Same number cases = 6
Let A be the event of getting same number.
Probability [p(A)] = $\frac{Number\, of\, favourable\ cases }{Total\, number\, of\, cases}$
$p\left ( A \right )= \frac{6}{36}= \frac{1}{6}$
(ii) Different number cases = 36 – same number case
= 36 –6 = 30
Let A be the event of getting different number
Probability [p(A)]= $\frac{Number\, of\, favourable\ cases }{Total\, number\, of\, cases}$
$p\left ( A \right )= \frac{30}{36}= \frac{5}{6}$
Question 20
Answer:
(i) Answer. [1/6]
Solution.Probability ; probability means possibility. It is a branch of mathematics that deals with the occurrence of a random event. The value is expressed from zero to one
Total cases after throwing of two dice = 36
Cases when total is 7 = (1, 6), (6, 1), (3, 4), (4, 3), (2, 5), (5, 2)
Total cases = 6
Let A be the event of getting total 7
Probability [p(A)]= $\frac{Number\, of\, favourable\ cases }{Total\, number\, of\, cases}$
Probability of getting sum 7 = $\frac{6}{36}= \frac{1}{6}$
(ii) Answer.[5/12]
Solution. Probability ; probability means possibility. It is a branch of mathematics that deals with the occurrence of a random event. The value is expressed from zero to one
Total cases = 36
Prime number as a sum = (1, 1), (1, 2), (2, 1), (1, 4),
(4, 1), (2, 3), (3, 2), (1, 6), (6, 1), (3, 4), (4, 3), (2, 5), (5, 2), (6, 5), (5, 6)
Cases = 15
Probability = $\frac{Number\, of\, favourable\ cases }{Total\, number\, of\, cases}$
Probability that sum is a prime number = $\frac{15}{36}= \frac{5}{12}$
(iii) Answer.[0]
Solution.Probability ; probability means possibility. It is a branch of mathematics that deals with the occurrence of a random event. The value is expressed from zero to one
Total cases = 36
pairs from which we get sum 1 = 0
Cases = 0
Probability = $\frac{Number\, of\, favourable\ cases }{Total\, number\, of\, cases}$
Probability of getting sum 1 = $\frac{0}{36}= 0$
Question 21
Answer:
(i) Answer. [1/9]
Solution.Probability; probability means possibility. It is a branch of mathematics that deals with the occurrence of a random event. The value is expressed from zero to one
Total cases = 36
For getting product 6 = (1, 6,), (6, 1), (2, 3), (3, 2)
Cases = 4
Probability = $\frac{Number\, of\, favourable\ cases }{Total\, number\, of\, cases}$
Probability of getting product 6 =$\frac{4}{36}= \frac{1}{9}$
(ii) Answer.[1/9]
Solution.Probability; probability means possibility. It is a branch of mathematics that deals with the occurrence of a random event. The value is expressed from zero to one
Total cases = 36
product 12 = (2, 6), (6, 2), (3, 4), (4, 3)
Cases = 4
Probability = $\frac{Number\, of\, favourable\ cases }{Total\, number\, of\, cases}$
Probability of getting product 12 =$\frac{4}{36}= \frac{1}{9}$
(iii) Answer.[0]
Solution.Probability; probability means possibility. It is a branch of mathematics that deals with the occurrence of a random event. The value is expressed from zero to one
Total cases = 36
Product 7 = 0 (case)
Cases = 0
Probability = $\frac{Number\, of\, favourable\ cases }{Total\, number\, of\, cases}$
Probability of getting product 7 =$\frac{0}{36}= 0$
Question 22
Answer:
Answer.[4/9]
Solution.Probability; Probability means possibility. It is a branch of mathematics that deals with the occurrence of a random event. The value is expressed from zero to one
Total cases in throwing two dice = 36
Product less than 9 cases = (1, 1). (1, 2), (1, 3), (1, 4), (1, 5), (1, 6), (2, 1), (2, 2), (2, 3), (2, 4), (3, 1), (3, 2), (4, 1), (4, 2), (5, 1), (6, 1)
Number of favourable cases = 16
Probability = $\frac{Number\, of\, favourable\ cases }{Total\, number\, of\, cases}$
Probability of getting product less than 9 = $\frac{16}{36}= \frac{4}{9}$
Question 23
Answer:
Solution.Probability; Probability means possibility. It is a branch of mathematics that deals with the occurrence of a random event. The value is expressed from zero to one
Total number of cases = 36
case of getting sum 2 = ( 1 , 1 ) ( 1 , 1 )
Probability = $\frac{Number\, of\, favourable\ cases }{Total\, number\, of\, cases}$
Probability of getting sum 2 = $\frac{2}{36}= \frac{1}{18}$
case of getting sum 3 = (1, 2), (1, 2), (2, 1), (2, 1)
Probability = $\frac{Number\, of\, favourable\ cases }{Total\, number\, of\, cases}$
Probability of getting sum 3= $\frac{4}{36}= \frac{1}{9}$
case of getting sum 4 = (1, 3), (1, 3), (2, 2), (2, 2), (3, 1), (3, 1)
Probability = $\frac{Number\, of\, favourable\ cases }{Total\, number\, of\, cases}$
Probability of getting sum 4= $\frac{6}{36}= \frac{1}{6}$
case of getting sum 5 = (2, 3), (2, 3), (4, 1),(4,1) (3, 2), (3, 2)
Probability = $\frac{Number\, of\, favourable\ cases }{Total\, number\, of\, cases}$
Probability of getting sum 5 = $\frac{6}{36}= \frac{1}{6}$
case of getting sum 6 = (3, 3), (3, 3), (4, 2), (4, 2), (5, 1), (5, 1)
probability = $\frac{Number\, of\, favourable\ cases }{Total\, number\, of\, cases}$
Probability of getting sum 6= $\frac{6}{36}= \frac{1}{6}$
case of getting sum 7 = (4, 3), (4, 3), (5, 2), (5, 2), (6, 1), (6, 1)
probability = $\frac{Number\, of\, favourable\ cases }{Total\, number\, of\, cases}$
Probability of getting sum 7= $\frac{6}{36}= \frac{1}{6}$
case of getting sum 8 = (5, 3), (5, 3), (6, 2), (6, 2)
probability = $\frac{Number\, of\, favourable\ cases }{Total\, number\, of\, cases}$
Probability of getting sum 8= $\frac{4}{36}= \frac{1}{9}$
case of getting sum 9 = (6, 3), (6, 3)
probability = $\frac{Number\, of\, favourable\ cases }{Total\, number\, of\, cases}$
Probability of getting sum 9= $\frac{2}{36}= \frac{1}{18}$
Question 24
A coin is tossed two times. Find the probability of getting at most one head.
Answer:
Answer. [3/4]
Solution. Probability; Probability means possibility. It is a branch of mathematics that deals with the occurrence of a random event. The value is expressed from zero to one
Total cases = 4 (HH, TT, HT, TH)
Cases of at most 1 head = HT, TH, TT
Probability = $\frac{Number\, of\, favourable\ cases }{Total\, number\, of\, cases}$
Probability of getting at most 1 head = $\frac{3}{4}$
Question 25
Answer:
(i) Answer. [1/8]
Solution.Probability; Probability means possibility. It is a branch of mathematics that deals with the occurrence of a random event. The value is expressed from zero to one.
Possible outcomes = (HHH, HHT, HTH, THH, TTT, TTH, THT, HTT)
Total cases = 8
Cases of getting all heads = (HHH)
Number of favourable cases = 1
Probability = $\frac{Number\, of\, favourable\ cases }{Total\, number\, of\, cases}$
Probability of getting all heads = $\frac{1}{8}$
(ii) Answer.[1/2]
Solution.Probability; Probability means possibility. It is a branch of mathematics that deals with the occurrence of a random event. The value is expressed from zero to one.
Possible outcomes = 8 (HHH, HHT, HTH, THH, TTT, TTH, THT, HTT)
Cases of getting at least 2 heads = (HHH, HHT, HTH, THH)
Favorable cases = 4
Probability = $\frac{Number\, of\, favourable\ cases }{Total\, number\, of\, cases}$
Probability of getting at least 2 heads = $\frac{4}{8}= \frac{1}{2}$
Question 26
Answer:
Answer. [2/9]
Solution. Probability; Probability means possibility. It is a branch of mathematics that deals with the occurrence of a random event. The value is expressed from zero to one
Cases of getting difference 2 = (1, 3), (3, 1), (2, 4), (4, 2), (3, 5), (5, 3), (4, 6), (6, 4)
Favourable cases = 8
Probability = $\frac{Number\, of\, favourable\ cases }{Total\, number\, of\, cases}$
Probability of getting difference 2 = $\frac{8}{36}= \frac{2}{9}$
Question 27
Answer:
(i) Answer.[5/11]
Solution.Probability; Probability means possibility. It is a branch of mathematics that deals with the occurrence of a random event. The value is expressed from zero to one
Total balls = 10 + 5 + 7 = 22
Red balls = 10
Probability = $\frac{Number\, of\, favourable\ cases }{Total\, number\, of\, cases}$
Probability of getting red ball = $\frac{10}{22}= \frac{5}{11}$
(ii) Answer.[7/22]
Solution. Probability; Probability means possibility. It is a branch of mathematics that deals with the occurrence of a random event. The value is expressed from zero to one
Total balls = 10 + 5 + 7 = 22
Green balls = 7
Probability = $\frac{Number\, of\, favourable\ cases }{Total\, number\, of\, cases}$
Probability of getting green ball = $\frac{7}{22}$
(iii) Answer.[17/22]
Solution.Probability; Probability means possibility. It is a branch of mathematics that deals with the occurrence of a random event. The value is expressed from zero to one
Total balls = 10 + 5 + 7 = 22
Not a blue ball = 22 – (blue ball)
= 22 – 5 = 17
robability = $\frac{Number\, of\, favourable\ cases }{Total\, number\, of\, cases}$
Probability of getting not a blue ball = $\frac{17}{22}$
Question 28
Answer:
(i) Answer.[13/49]
Solution.Probability; Probability means possibility. It is a branch of mathematics that deals with the occurrence of a random event. The value is expressed from zero to one
Total cards = 52 – 3 ( three cards are removed)
= 49
Total hearts = 13
Favourable cases = 13
Probability = $\frac{Number\, of\, favourable\ cases }{Total\, number\, of\, cases}$
Probability of getting a heart = $\frac{13}{49}$
(ii) Answer.[3/49]
Solution.Probability; Probability means possibility. It is a branch of mathematics that deals with the occurrence of a random event. The value is expressed from zero to one
Total cards = 52 – 3 ( three cards are removed)
= 49
Total king = 4 – 1 = 3 ( 1 king is removed)
favourable cases = 3
bability = $\frac{Number\, of\, favourable\ cases }{Total\, number\, of\, cases}$
Probability of getting a King= $\frac{3}{49}$
Question 29
Answer:
(i) Answer.[10/49]
Solution.Probability; Probability means possibility. It is a branch of mathematics that deals with the occurrence of a random event. The value is expressed from zero to one
Total cards = 52 – 3 = 49 ( three cards are removed)
Total club = 13 – 3 = 10 ( 3 club cards are removed)
favourable cases = 10
Probability = $\frac{Number\, of\, favourable\ cases }{Total\, number\, of\, cases}$
Probability of getting a club = $\frac{10}{49}$
(ii) Answer.[1/49]
Solution.Probability; Probability means possibility. It is a branch of mathematics that deals with the occurrence of a random event. The value is expressed from zero to one
Total cards = 52 – 3 = 49 ( three cards are removed)
10 of heart = 1
favourable cases = 1
Probability = $\frac{Number\, of\, favourable\ cases }{Total\, number\, of\, cases}$
Probability of getting a heart = $\frac{1}{49}$
Question 30
Answer:
(i) Answer.[1/10]
Solution.Probability; Probability means possibility. It is a branch of mathematics that deals with the occurrence of a random event. The value is expressed from zero to one
Total cards = 52 – 12 = 40 ( 12 cards are removed)
card with number 7 = 4
favourable cases = 4
probability = $\frac{Number\, of\, favourable\ cases }{Total\, number\, of\, cases}$
Probability of getting card 7= $\frac{4}{10}= \frac{1}{10}$
(ii) Answer. [3/10]
Solution.Probability; Probability means possibility. It is a branch of mathematics that deals with the occurrence of a random event. The value is expressed from zero to one
Total cards = 52 – 12 = 40 ($\mathbb{Q}$ 12 cards are removed)
Cards greater than 7 =8,9,10 (3 × 4 = 12)
favourable cases = 12
probability = $\frac{Number\, of\, favourable\ cases }{Total\, number\, of\, cases}$
Probability of getting card 7= $\frac{12}{40}= \frac{3}{10}$
(iii) Answer. [3/5]
Solution.Probability; Probability means possibility. It is a branch of mathematics that deals with the occurrence of a random event. The value is expressed from zero to one
Total cards = 52 – 12 = 40 ($\because$ 12 cards are removed)
Cards less than 7 = 1, 2, 3, 4, 5, 6 (6 × 4 = 24)
favourable cases = 24
probability = $\frac{Number\, of\, favourable\ cases }{Total\, number\, of\, cases}$
Probability of getting card 7= $\frac{24}{40}= \frac{6}{10}= \frac{3}{5}$
Question 31
Answer:
(i) Answer.[14/99]
Solution.Probability; Probability means possibility. It is a branch of mathematics that deals with the occurrence of a random event. The value is expressed from zero to one
Total number = 99 (between 0 to 100)
Number divisible by 7 = (7, 14, 21, 28,35, 42, 49, 56, 63, 70, 77, 84, 91, 98)
Favourable cases = 14
Probability = $\frac{Number\, of\, favourable\ cases }{Total\, number\, of\, cases}$
Probability of getting number divisible by 7 = $\frac{14}{99}$
(ii) Answer.[85/99]
Solution.Probability; Probability means possibility. It is a branch of mathematics that deals with the occurrence of a random event. The value is expressed from zero to one
Total number between 0 to 100 = 99
Number divisible by 7 = (7, 14, 21, 28,35, 42, 49, 56, 63, 70, 77, 84, 91, 98)
Favourable cases = 14
robability = $\frac{Number\, of\, favourable\ cases }{Total\, number\, of\, cases}$
Probability of getting number divisible by 7 = $\frac{14}{99}$
$= 1-\frac{14}{99}$
$= \frac{99-14}{99}= \frac{85}{99}$
Question 32
Answer:
(i) Answer.[1/2]
Solution.Probability; Probability means possibility. It is a branch of mathematics that deals with the occurrence of a random event. The value is expressed from zero to one
Total numbers from 2 to 101 = 100
Total even numbers from 2 to 101 = 50
Favourable cases = 50
Probability = $\frac{Number\, of\, favourable\ cases }{Total\, number\, of\, cases}$
Probability that card is with even number = $\frac{50}{100}= \frac{1}{2}$
(ii) Answer.[9/100]
Solution.Probability; Probability means possibility. It is a branch of mathematics that deals with the occurrence of a random event. The value is expressed from zero to one
Total number from 2 to 101 = 100
Square numbers from 2 to 101 = (4, 9, 16, 25, 36, 49, 64, 81, 100)
Favourable cases = 9
Probability = $\frac{Number\, of\, favourable\ cases }{Total\, number\, of\, cases}$
Probability that the card is with a square number = $\frac{9}{100}$
Question 33
Answer:
Answer.[21/26]
Solution.Probability; Probability means possibility. It is a branch of mathematics that deals with the occurrence of a random event. The value is expressed from zero to one
Total alphabets = 26
Total consonant = 21
Favourable cases = 21
Probability = $\frac{Number\, of\, favourable\ cases }{Total\, number\, of\, cases}$
Probability that alphabet is consonant = $\frac{21}{26}$
Question 34
Answer:
Answer.[0.69]
Solution.Probability; Probability means possibility. It is a branch of mathematics that deals with the occurrence of a random event. The value is expressed from zero to one
Total envelopes = 1000
Envelopes with no cash prize = Total envelopes – envelopes with cash prize
= 1000 – 10 – 100 – 200 = 690
Favourable cases = 690
Probability = $\frac{Number\, of\, favourable\ cases }{Total\, number\, of\, cases}$
Probability that the envelope is no cash prize = $\frac{690}{1000}= \frac{69}{100}= 0\cdot 69$
Question 35
Answer:
Answer.[11/75]
Solution.Probability; Probability means possibility. It is a branch of mathematics that deals with the occurrence of a random event. The value is expressed from zero to one
Total slips = 25 + 50 = 75
Slips marked other than 1 = Rs. 5 slips + Rs. 13 slips
= 6 + 5 = 11
Favourable cases = 11
Probability = $\frac{Number\, of\, favourable\ cases }{Total\, number\, of\, cases}$
Probability that slips is not marked 1 $= \frac{11}{75}$
Question 36
Answer:
Answer.[5/23]
Solution.Probability; Probability means possibility. It is a branch of mathematics that deals with the occurrence of a random event. The value is expressed from zero to one
Total bulbs = 24
Defective = 6
not defective = 18
Probability that the bulb is not defective = $\frac{18}{24}= \frac{3}{4}$
Let the bulbs is defective and it is removed from 24 bulb.
Now bulbs remain = 23
In 23 bulbs, non-defective bulbs = 18
defective = 5
Probability = $\frac{Number\, of\, favourable\ cases }{Total\, number\, of\, cases}$
Now probability that the bulb is defective = $\frac{5}{23}$ .
Question 37
Answer:
(i) Answer.[4/9]
Solution.Probability; Probability means possibility. It is a branch of mathematics that deals with the occurrence of a random event. The value is expressed from zero to one
Total piece = 8 + 10 = 18
Total triangles = 8
Favourable cases = 8
Probability = $\frac{Number\, of\, favourable\ cases }{Total\, number\, of\, cases}$
Probability that piece is a triangle $= \frac{8}{18}= \frac{4}{9}$
(ii) Answer.[5/9]
Solution.Probability; Probability means possibility. It is a branch of mathematics that deals with the occurrence of a random event. The value is expressed from zero to one
Total piece = 8 + 10 = 18
Total square = 10
Favourable cases = 10
Probability = $\frac{Number\, of\, favourable\ cases }{Total\, number\, of\, cases}$
Probability that the piece is a square = $\frac{10}{18}= \frac{5}{9}$
(iii) Answer.[1/3]
Solution.Probability; Probability means possibility. It is a branch of mathematics that deals with the occurrence of a random event. The value is expressed from zero to one
Total piece = 10 + 8 = 18
Square of blue color = 6
favourable cases = 6
Probability = $\frac{Number\, of\, favourable\ cases }{Total\, number\, of\, cases}$
Probability that piece is a square of blue color = $\frac{6}{18}= \frac{1}{3}$
(iv) Answer.[5/18]
Solution.Probability; Probability means possibility. It is a branch of mathematics that deals with the occurrence of a random event. The value is expressed from zero to one
Total piece = 10 + 8 = 18
triangle of red color = 8 – 3 = 5
favourable cases = 5
Probability = $\frac{Number\, of\, favourable\ cases }{Total\, number\, of\, cases}$
Probability that piece is a triangle of red colour $= \frac{5}{18}$
Question 38
Answer:
(i) Answer.[1/8]
Solution.Probability; Probability means possibility. It is a branch of mathematics that deals with the occurrence of a random event. The value is expressed from zero to one
Total cases = 8(HHH, HHT, HTH, THH, TTT, TTH, THT, HTT)
case in which the lose entry = 8 – (in which she gets entry book + in which she gets double)
= 8 – 6 (HHT, HTH, THH, TTH, THT, HTT) – 1(HHH)
= 8 – 7 = 1
Favourable cases = 1
Probability = $\frac{Number\, of\, favourable\ cases }{Total\, number\, of\, cases}$
Probability that she will lose money = $\frac{1}{8}$
(ii) Answer.[1/8]
Solution.Probability; Probability means possibility. It is a branch of mathematics that deals with the occurrence of a random event. The value is expressed from zero to one
Total cases = 8(HHH, HHT, HTH, THH, TTT, TTH, THT, HTT)
case in which she gets double entry = HHH
favourable cases = 1
Probability = $\frac{Number\, of\, favourable\ cases }{Total\, number\, of\, cases}$
Probability that she gets double entry fee = $\frac{1}{8}$
(iii) Answer.[3/4]
Solution.Probability; Probability means possibility. It is a branch of mathematics that deals with the occurrence of a random event. The value is expressed from zero to one
Total cases = 8(HHH, HHT, HTH, THH, TTT, TTH, THT, HTT)
case in which she gets entry book = 6(HHT, HTH, THH, TTH, THT, HTT)
favourable cases = 6
Probability = $\frac{Number\, of\, favourable\ cases }{Total\, number\, of\, cases}$
Probability that she gets entry fees = $\frac{6}{8}= \frac{3}{4}$
Question 39
Answer:
(i) Answer.[6]
Solution. Count the number of sums we can notice by using two dice of (0, 1, 1, 1, 6, 6) type.
We can get a sum of 0 = (0,0)
We can get a sum of 1 = (0,1) , (1,0)
We can get a sum of 2 = (1,1)
We can get a sum of 6 = (0,6) , (6,0)
We can get a sum of 7 = (6,1) , (1,6)
We can get a sum of 12 = (6,6)
We can get a score of 0, 1, 2, 6, 7, 12
Hence we can get 6 different scores.
(ii) Answer.[4/9]
Solution.Probability; Probability means possibility. It is a branch of mathematics that deals with the occurrence of a random event. The value is expressed from zero to one
Total cases = 36
Case of getting sum 7 = (1, 6), (1, 6), (1, 6), (1, 6), (1, 6), (1, 6), (6,1), ( 6,1), (6,1), ( 6,1), (6,1), (6,1),
Number of favourable cases = 12
Probability = $\frac{Number\, of\, favourable\ cases }{Total\, number\, of\, cases}$
Probability of getting a total 7 = $\frac{12}{36}= \frac{1}{3}$
Question 40
(i) Answer.[7/8]
Solution.Probability; Probability means possibility. It is a branch of mathematics that deals with the occurrence of a random event. The value is expressed from zero to one
Total mobiles = 48
Minor defective = 3
major defective = 3
good = 42
Varnika buy only good so favourable cases = 42
Probability = $\frac{Number\, of\, favourable\ cases }{Total\, number\, of\, cases}$
Probability that acceptable to Varnika = $\frac{42}{48}= \frac{7}{8}$
(ii) Answer.[15/16]
Solution.Probability; Probability means possibility. It is a branch of mathematics that deals with the occurrence of a random event. The value is expressed from zero to one
total mobiles = 48
good = 42
minor defect = 3
major defect = 3
trader accept only good and minor defect.
So favourable cases = 42 + 3 = 45
Probability = $\frac{Number\, of\, favourable\ cases }{Total\, number\, of\, cases}$
Probability that trader accept $\frac{45}{48}= \frac{15}{16}$
Question 41
Answer:
(i) Answer.[5/6]
Solution.Probability; Probability means possibility. It is a branch of mathematics that deals with the occurrence of a random event. The value is expressed from zero to one
Total balls = red + white + blue
24 = x + 2x + 3x
6x = 24
x = 4
Red balls = x = 4
White balls = 2x = 2 × 4 = 8
Blue balls = 3x = 3 × 4 = 12
Probability = $\frac{Number\, of\, favourable\ cases }{Total\, number\, of\, cases}$
Probability that ball is not red = $\frac{blue+white}{24}$
$= \frac{8+12}{24}= \frac{20}{24}= \frac{5}{6}$
(ii) Answer.[1/3]
Solution.Probability; Probability means possibility. It is a branch of mathematics that deals with the occurrence of a random event. The value is expressed from zero to one
Total balls = red + white + blue
24 = 6x
x = 4
white balls = 2x = 2 × 4 = 8
Favourable cases = 8
Probability = $\frac{Number\, of\, favourable\ cases }{Total\, number\, of\, cases}$
Probability of getting on white ball = $\frac{8}{24}= \frac{1}{3}$
Question 42
Answer:
(i) Answer.[0.009]
Solution.Probability; Probability means possibility. It is a branch of mathematics that deals with the occurrence of a random event. The value is expressed from zero to one
Total cards = 1000
Player wins prize with cards = (529, 576, 625, 676, 729, 784, 841, 900, 961)
Favourable cases = 9
Probability = $\frac{Number\, of\, favourable\ cases }{Total\, number\, of\, cases}$
Probability that player wins = $\frac{9}{1000}= 0\cdot 009$
(ii) Answer.[0.008]
Solution.Probability: Probability means possibility. It is a branch of mathematics that deals with the occurrence of a random event. The value is expressed from zero to one
Now the total cards are = 1000 – 1 = 999
Now the total winning cards = 9 – 1 = 8
Probability = $\frac{Number\, of\, favourable\ cases }{Total\, number\, of\, cases}$
Probability that second player wins after first = $\frac{8}{999}\approx 0\cdot 008$
Students can find every NCERT Class 10 Maths Exemplar Solution in one spot on Careers360. Use the links below to access them.
Get your results instantly with our calculator!
NCERT Exemplar Class 10 Maths Solutions Chapter 13 pdf downloads are available through online tools for the students to access this content in an offline version, so that no breaks in continuity are faced while practising NCERT Exemplar Class 10 Maths Chapter 13.
These Class 10 Maths NCERT Exemplar chapter 13 Solutions provide a basic knowledge of statistics and probability, which has great importance in higher classes.
The questions based on statistics and probability can be practised in a better way, along with these Solutions.
The NCERT Exemplar Class 10 Maths chapter 13 solution, statistics and probability has a good amount of problems for practice and is sufficient for a student to solve the questions of other books.
You can get all NCERT Class 10 Maths Solutions at one location on Careers360. Open them using the links below.
Here are the subject-wise links for the NCERT Solutions of class 10:
Given below are the subject-wise NCERT Notes of class 10 :
Students are advised to go through the current syllabus at the start of the academic year to understand the topics to be covered. The updated syllabus links and recommended books are provided below.
Given below are the subject-wise Exemplar Solutions of class 10 NCERT:
Frequently Asked Questions (FAQs)
The subject experts at CAreers360 have developed the NCERT Exemplar Solutions for Chapter 13 of Class 10 Maths, keeping in mind the learning abilities of students. The solution PDF module is downloadable from BYJU'S website according to the students' needs. All crucial concepts are explained in plain language to aid students in achieving exam success with confidence. The solutions cover all problems in the NCERT textbook, allowing students to cross-check their answers and identify their areas of weakness.
Yes, the NCERT exemplar Class 10 Maths solutions chapter 13 pdf download feature provided this solution for students practicing NCERT exemplar Class 10 Maths chapter 13.
Below is a list of topics and subtopics covered in Chapter 13 of NCERT Exemplar Solutions for Class 10 Maths:
The mean is the arithmetic average of a given set of values, signifying an equal distribution of values in the dataset. Central tendency refers to the statistical measure that identifies a single value to represent the entire distribution, providing an accurate description of the whole data. This value is unique and represents the collected data. Mean, median, and mode are the three frequently used measures of central tendency.

On Question asked by student community
Hello Arun,
The CBSE Class 10 mid-term exam has yet to happen. In the meantime, please refer to the previous year's question paper:
https://school.careers360.com/boards/cbse/cbse-class-10-mid-term-exam-question-paper-answer-key-2025-26
Hello Dear Student,
You can get directly find, check, get more information here:
Hope it helps!
Hello Student,
If you are asking how to download the migration certificate for Class 10 Karnataka Board, here is how to do it -
You will have to log in to the DigiLocker app or website using your Aadhaar card number and the registered mobile number for the OTP.
You
Hello Student,
The CBSE Class 10th board exam supplementary results can be announced in the second week of July. You can visit the official websites for the results. You will have to enter your roll number, school number, and the admit card ID.
I am also sharing a link of
A block of mass 0.50 kg is moving with a speed of 2.00 ms-1 on a smooth surface. It strikes another mass of 1.00 kg and then they move together as a single body. The energy loss during the collision is
| Option 1)
|
Option 2)
|
| Option 3)
|
Option 4)
|
An athlete in the olympic games covers a distance of 100 m in 10 s. His kinetic energy can be estimated to be in the range
| Option 1)
|
Option 2)
|
| Option 3)
|
Option 4)
|
A particle is projected at 600 to the horizontal with a kinetic energy . The kinetic energy at the highest point
| Option 1)
|
Option 2)
|
| Option 3)
|
Option 4)
|
In the reaction,
| Option 1)
|
Option 2)
|
| Option 3)
|
Option 4)
|
How many moles of magnesium phosphate, will contain 0.25 mole of oxygen atoms?
| Option 1)
0.02 |
Option 2)
3.125 × 10⁻² |
| Option 3)
1.25 × 10⁻² |
Option 4)
2.5 × 10⁻² |
Study at a world-renowned UK university in India | Admissions open for UG & PG programs.
Apply for UG & PG programmes from Victoria University, Delhi NCR Campus
Admissions open for UG & PG programs at Illinois Tech Mumbai
Apply for UG & PG courses at University of Aberdeen, Mumbai Campus
UG & PG Admissions open for CS/AI/Business/Economics & other programmes.
Bristol's expertise meets Mumbai's innovation. Admissions open for UG & PG programmes