Emversity Allied Health Programs
Get Job Ready in Healthcare | Employability-Focused Programs


Hey!! Are you still wondering about reading this article and looking at the solutions or not? Then let me tell you, do not think twice and start reading without confusion, as these solutions are prepared specifically for every type of student in a friendly manner, with brief introductions to important concepts. Let me explain to you what the NCERT Class 10 chapter 13 Statistics is about. Statistics is the art of turning numbers into stories. It teaches us that every number has a voice and every graph can show us a story. This chapter will focus on the measurement of central tendencies like median, mode, and mean to analyse the grouped and ungrouped data. These NCERT solutions for Class 10 Maths will clear all your doubts about the exercise of this chapter and teach you several new problem-solving methods.
This Story also Contains
Statistics is like detective work with numbers: we collect clues (data), sort them, and find out what story they tell! Our academic team here at Careers360 comprises experienced experts with years of teaching experience who have developed these NCERT Solutions for Class 10 content based on the latest NCERT Syllabus. Students preparing for the Class 10 board exams must go through these solutions to strengthen basic concepts, along with learning how to solve these questions, so that they can solve similar questions on their own. Many teachers recommend NCERT Solutions because they closely match the exam pattern. Check this NCERT article for complete syllabus coverage along with NCERT Books, Solutions, Syllabus, and Exemplar Problems with Solutions.
These NCERT Solutions for Class 10 Maths Chapter 13 Statistics have been prepared by Careers360 experts to make learning simpler and to help you score better in exams. A downloadable PDF is available — click the link below to access it.
Below, you will find the NCERT Class 10 Maths Chapter 13 Statistics question answers explained step by step.
|
Statistics Class 10 Question Answers |
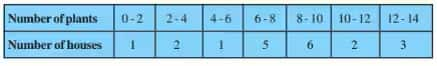
Which method did you use to find the mean, and why?
Answer:
|
Number of plants
|
Number of houses $f_i$ |
Classmark $x_i$ |
$f_ix_i$ |
|
0-2 |
1 |
1 |
1 |
|
2-4 |
2 |
3 |
6 |
|
4-6 |
1 |
5 |
5 |
|
6-8 |
5 |
7 |
35 |
|
8-10 |
6 |
9 |
54 |
|
10-12 |
2 |
11 |
22 |
|
12-14 |
3 |
13 |
39 |
|
|
$\sum f_i$ =20 |
|
$\sum f_ix_i$ =162 |
Mean,
$\overline x = \frac{\sum f_ix_i}{\sum f_i}$
$= \frac{162}{20} = 8.1$
We used the direct method in this as the values of $x_i$ and $f_i$ are small.
Q2: Consider the following distribution of daily wages of 50 workers of a factory. Find the mean daily wages of the workers of the factory by using an appropriate method.
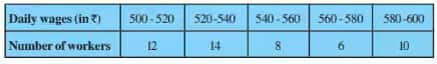
Answer:
Let the assumed mean be a = 550
|
Daily Wages |
Number of workers $f_i$ |
Classmark $x_i$ |
$d_i = x_i -a$ |
$f_id_i$ |
|
500-520 |
12 |
510 |
-40 |
-480 |
|
520-540 |
14 |
530 |
-20 |
-280 |
|
540-560 |
8 |
550 |
0 |
0 |
|
560-580 |
6 |
570 |
20 |
120 |
|
580-600 |
10 |
590 |
40 |
400 |
|
|
$\sum f_i$ = 50 |
|
|
$\sum f_i d_i$ = -240
|
Mean,
$\overline x =a + \frac{\sum f_id_i}{\sum f_i}$
$= 550 + \frac{-240}{50} = 550-4.8 = 545.20$
Therefore, the mean daily wages of the workers of the factory is Rs. 545.20.
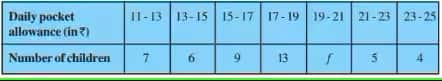
Answer:
|
Daily pocket allowance |
Number of children $f_i$ |
Classmark $x_i$ |
$f_ix_i$ |
|
11-13 |
7 |
12 |
84 |
|
13-15 |
6 |
14 |
84 |
|
15-17 |
9 |
16 |
144 |
|
17-19 |
13 |
18 |
234 |
|
19-21 |
f |
20 |
20f |
|
21-23 |
5 |
22 |
110 |
|
23-25 |
4 |
24 |
96 |
|
|
$\sum f_i$ = 44 + f |
|
$\sum f_ix_i$ = 752 + 20f |
Mean,
$\overline x = \frac{\sum f_ix_i}{\sum f_i}$
$⇒18 = \frac{752+20f}{44+f}$
$⇒18(44+f) =( 752+20f)$
$⇒ 2f = 40 $
$⇒ f = 20$
Therefore, the missing f = 20.
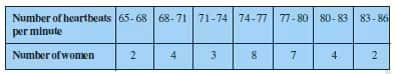
Answer:
Let the assumed mean be a = 75.5
|
No. of heartbeats per minute |
Number of women $f_i$ |
Classmark $x_i$ |
$d_i = x_i -a$ |
$f_id_i$ |
|
65-68 |
2 |
66.5 |
-9 |
-18 |
|
68-71 |
4 |
69.5 |
-6 |
-24 |
|
71-74 |
3 |
72.5 |
-3 |
-9 |
|
74-77 |
8 |
75.5 |
0 |
0 |
|
77-80 |
7 |
78.5 |
3 |
21 |
|
80-83 |
4 |
81.5 |
6 |
24 |
|
83-86 |
2 |
84.5 |
9 |
18 |
|
|
$\sum f_i$ = 30 |
|
|
$\sum f_id_i$ = 12 |
Mean,
$\overline x =a + \frac{\sum f_id_i}{\sum f_i}$
$= 75.5 + \frac{12}{30} = 75.5 + 0.4 = 75.9$
Therefore, the mean heartbeats per minute of these women are 75.9.
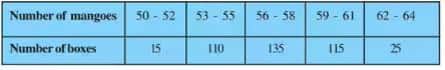
Find the mean number of mangoes kept in a packing box. Which method of finding the mean did you choose?
Answer:
Let the assumed mean be a = 57
|
Number of mangoes |
Number of boxes $f_i$ |
Classmark $x_i$ |
$d_i = x_i -a$ |
$f_id_i$ |
|
50-52 |
15 |
51 |
-6 |
-90 |
|
53-55 |
110 |
54 |
-3 |
-330 |
|
56-58 |
135 |
57 |
0 |
0 |
|
59-61 |
115 |
60 |
3 |
345 |
|
62-64 |
25 |
63 |
6 |
150 |
|
|
$\sum f_i$ = 400 |
|
|
$\sum f_id_i$ = 75 |
Mean,
$\overline x =a + \frac{\sum f_id_i}{\sum f_i}$
$= 57+ \frac{75}{400} = 57+0.1875 = 57.1875 \approx 57.19$
Therefore, the mean number of mangoes kept in a packing box is approximately 57.19.
Q6: The table below shows the daily expenditure on food of 25 households in a locality. Find the mean daily expenditure on food by a suitable method.
|
Daily expenditure in rupees | 100-150 | 150-200 | 200-250 | 250-300 | 300-350 |
| Number of households | 4 | 5 | 12 | 2 | 2 |
Answer:
Let the assumed mean be a = 225 and h = 50
|
Daily Expenditure |
Number of households $f_i$ |
Classmark $x_i$ |
$d_i = x_i -a$ |
$u_i = \frac{d_i}{h}$ |
$f_iu_i$ |
|
100-150 |
4 |
125 |
-100 |
-2 |
-8 |
|
150-200 |
5 |
175 |
-50 |
-1 |
-5 |
|
200-250 |
12 |
225 |
0 |
0 |
0 |
|
250-300 |
2 |
275 |
50 |
1 |
2 |
|
300-350 |
2 |
325 |
100 |
2 |
4 |
|
|
$\sum f_i$ = 25 |
|
|
|
$\sum f_iu_i$ = -7 |
Mean,
$\overline x =a + \frac{\sum f_iu_i}{\sum f_i}\times h$
$= 225 + \frac{-7}{25}\times50 = 225 -14 = 211$
Therefore, the mean daily expenditure on food is Rs. 211.
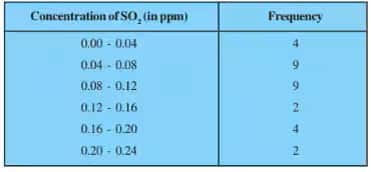
Find the mean concentration of $SO_2$ in the air.
Answer:
|
Class Interval |
Frequency $f_i$ |
Classmark $x_i$ |
$f_ix_i$ |
|
0.00-0.04 |
4 |
0.02 |
0.08 |
|
0.04-0.08 |
9 |
0.06 |
0.54 |
|
0.08-0.12 |
9 |
0.10 |
0.90 |
|
0.12-0.16 |
2 |
0.14 |
0.28 |
|
0.16-0.20 |
4 |
0.18 |
0.72 |
|
0.20-0.24 |
2 |
0.22 |
0.44 |
|
|
$\sum f_i$ =30 |
|
$\sum f_ix_i$ =2.96 |
Mean,
$\overline x = \frac{\sum f_ix_i}{\sum f_i}$
$= \frac{2.96}{30} = 0.099$
Therefore, the mean concentration of $SO_2$ in the air is 0.099 ppm.
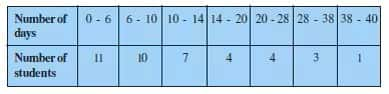
Answer:
|
Number of days |
Number of Students $f_i$ |
Classmark $x_i$ |
$f_ix_i$ |
|
0-6 |
11 |
3 |
33 |
|
6-10 |
10 |
8 |
80 |
|
10-14 |
7 |
12 |
84 |
|
14-20 |
4 |
17 |
68 |
|
20-28 |
4 |
24 |
96 |
|
28-38 |
3 |
33 |
99 |
|
38-40 |
1 |
39 |
39 |
|
|
$\sum f_i$ = 40 |
|
$\sum f_ix_i$ = 499 |
Mean,
$\overline x = \frac{\sum f_ix_i}{\sum f_i}$
$= \frac{499}{40} = 12.475$ $= \frac{499}{40} = 12.475\approx 12.48$
Therefore, the mean number of days a student was absent was 12.48 days.
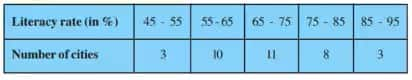
Answer:
Let the assumed mean be a = 75 and h = 10
|
Literacy rates |
Number of cities $f_i$ |
Classmark $x_i$ |
$d_i = x_i -a$ |
$u_i = \frac{d_i}{h}$ |
$f_iu_i$ |
|
45-55 |
3 |
50 |
-20 |
-2 |
-6 |
|
55-65 |
10 |
60 |
-10 |
-1 |
-10 |
|
65-75 |
11 |
70 |
0 |
0 |
0 |
|
75-85 |
8 |
80 |
10 |
1 |
8 |
|
85-95 |
3 |
90 |
20 |
2 |
6 |
|
|
$\sum f_i$ = 35 |
|
|
|
$\sum f_iu_i$ = -2 |
Mean,
$\overline x =a + \frac{\sum f_iu_i}{\sum f_i}\times h$
$= 70 + \frac{-2}{35}\times10 = 70 -0.57 = 69.43$
Therefore, the mean literacy rate is 69.43%.
|
Statistics Class 10 Question Answers |
Q1: The following table shows the ages of the patients admitted in a hospital during a year:
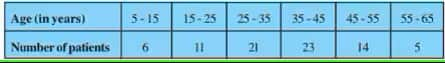
Find the mode and the mean of the data given above. Compare and interpret the two measures of central tendency.
Answer:
The class with the maximum frequency is the modal class.
The maximum frequency is 23, and hence the modal class = 35-45
Lower limit (l) of modal class = 35, class size (h) = 10
Frequency ( $f_1$ ) of the modal class = 23, frequency ( $f_0$ ) of class preceding the modal class = 21, frequency ( $f_2$ ) of class succeeding the modal class = 14.
$Mode = l + \left(\frac{f_1-f_0}{2f_1 - f_0 - f_2} \right).h$
$\\ = 35 + \left(\frac{23-21}{2(23)-21-14} \right).10 \\ \\ = 35 + \frac{2}{11}.10$
$= 36.8$
Now,
|
Age
|
Number of patients $f_i$ |
Classmark $x_i$ |
$f_ix_i$ |
|
5-15 |
6 |
10 |
60 |
|
15-25 |
11 |
20 |
220 |
|
25-35 |
21 |
30 |
630 |
|
35-45 |
23 |
40 |
920 |
|
45-55 |
14 |
50 |
700 |
|
55-65 |
5 |
60 |
300 |
|
|
$\sum f_i$ =80 |
|
$\sum f_ix_i$ =2830 |
Mean,
$\overline x = \frac{\sum f_ix_i}{\sum f_i}$
$= \frac{2830}{80} = 35.37$
The maximum number of patients is in the age group of 36.8, whereas the average age of all the patients is 35.37.
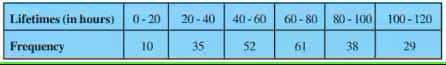
Determine the modal lifetimes of the components.
Answer:
The class with the maximum frequency is the modal class.
The maximum frequency is 61, and hence, the modal class = 60-80
Lower limit (l) of modal class = 60, class size (h) = 20
Frequency ( $f_1$ ) of the modal class = 61, frequency ( $f_0$ ) of class preceding the modal class = 52, frequency ( $f_2$ ) of class succeeding the modal class = 38.
$Mode = l + \left(\frac{f_1-f_0}{2f_1 - f_0 - f_2} \right).h$
$\\ = 60 + \left(\frac{61-52}{2(61)-52-38} \right)\times20 \\ \\ = 60 + \frac{9}{32}\times20$
$= 65.62$
Thus, the modal lifetime of 225 electrical components is 65.62 hours.
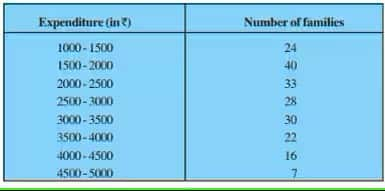
Answer:
The class with the maximum frequency is the modal class.
The maximum frequency is 40, and hence the modal class = 1500-2000
Lower limit (l) of modal class = 1500, class size (h) = 500
Frequency ( $f_1$ ) of the modal class = 40, frequency ( $f_0$ ) of class preceding the modal class = 24, frequency ( $f_2$ ) of class succeeding the modal class = 33.
$Mode = l + \left(\frac{f_1-f_0}{2f_1 - f_0 - f_2} \right).h$
$\\ = 1500 + \left(\frac{40-24}{2(40)-24-33} \right).500 \\ \\ = 1500 + \frac{16}{23}.500$
$= 1847.82$
Thus, the Mode of the data is Rs. 1847.82
Now,
Let the assumed mean be a = 2750 and h = 500
|
Expenditure |
Number of families $f_i$ |
Classmark $x_i$ |
$d_i = x_i -a$ |
$u_i = \frac{d_i}{h}$ |
$f_iu_i$ |
|
1000-1500 |
24 |
1250 |
-1500 |
-3 |
-72 |
|
1500-2000 |
40 |
1750 |
-1000 |
-2 |
-80 |
|
2000-2500 |
33 |
2250 |
-500 |
-1 |
-33 |
|
2500-3000 |
28 |
2750 |
0 |
0 |
0 |
|
3000-3500 |
30 |
3250 |
500 |
1 |
30 |
|
3500-4000 |
22 |
3750 |
1000 |
2 |
44 |
|
4000-4500 |
16 |
4250 |
1500 |
3 |
48 |
|
4500-5000 |
7 |
4750 |
2000 |
4 |
28 |
|
|
$\sum f_i$ =200 |
|
|
|
$\sum f_iu_i$ = -35 |
Mean,
$\overline x =a + \frac{\sum f_iu_i}{\sum f_i}\times h$
$= 2750 + \frac{-35}{200}\times500 = 2750 -87.5 = 2662.50$
Thus, the Mean monthly expenditure is Rs. 2662.50.
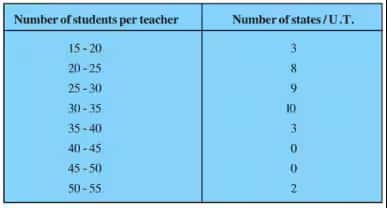
Answer:
The class with the maximum frequency is the modal class.
The maximum frequency is 10, and hence the modal class = 30-35
Lower limit (l) of modal class = 30, class size (h) = 5
Frequency ( $f_1$ ) of the modal class = 10 frequency ( $f_0$ ) of class preceding the modal class = 9, frequency ( $f_2$ ) of class succeeding the modal class = 3
$Mode = l + \left(\frac{f_1-f_0}{2f_1 - f_0 - f_2} \right).h$
$\\ = 30 + \left(\frac{10-9}{2(10)-9-3} \right).5 \\ \\ = 30 + \frac{1}{8}.5$
$= 30.625$
Thus, the Mode of the data is 30.625
Now,
Let the assumed mean be a = 32.5 and h = 5
|
Class |
Number of states $f_i$ |
Classmark $x_i$ |
$d_i = x_i -a$ |
$u_i = \frac{d_i}{h}$ |
$f_iu_i$ |
|
15-20 |
3 |
17.5 |
-15 |
-3 |
-9 |
|
20-25 |
8 |
22.5 |
-10 |
-2 |
-16 |
|
25-30 |
9 |
27.5 |
-5 |
-1 |
-9 |
|
30-35 |
10 |
32.5 |
0 |
0 |
0 |
|
35-40 |
3 |
37.5 |
5 |
1 |
3 |
|
40-45 |
0 |
42.5 |
10 |
2 |
0 |
|
45-50 |
0 |
47.5 |
15 |
3 |
0 |
|
50-55 |
2 |
52.5 |
20 |
4 |
8 |
|
|
$\sum f_i$ =35 |
|
|
|
$\sum f_iu_i$ = -23 |
Mean,
$\overline x =a + \frac{\sum f_iu_i}{\sum f_i}\times h$
$= 32.5 + \frac{-23}{35}\times5= 29.22$
Thus, the Mean of the data is 29.22.
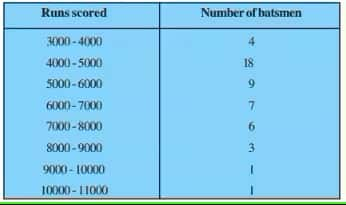
Answer:
The class with the maximum frequency is the modal class.
The maximum frequency is 18, and hence, the modal class = 4000-5000
Lower limit (l) of modal class = 4000, class size (h) = 1000
Frequency ( $f_1$ ) of the modal class = 18 frequency ( $f_0$ ) of class preceding the modal class = 4, frequency ( $f_2$ ) of class succeeding the modal class = 9
$Mode = l + \left(\frac{f_1-f_0}{2f_1 - f_0 - f_2} \right).h$
$\\ =4000 + \left(\frac{18-4}{2(18)-4-9} \right).1000 \\ \\ = 4000 + \frac{14}{23}.1000$
$= 4608.70$
Thus, the Mode of the data is 4608.70.
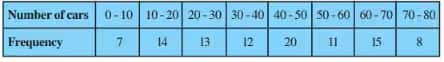
Answer:
The class with the maximum frequency is the modal class.
The maximum frequency is 20, and hence, the modal class = 40-50
Lower limit (l) of modal class = 40, class size (h) = 10
Frequency ( $f_1$ ) of the modal class = 20 frequency ( $f_0$ ) of class preceding the modal class = 12, frequency ( $f_2$ ) of class succeeding the modal class = 11
$Mode = l + \left(\frac{f_1-f_0}{2f_1 - f_0 - f_2} \right).h$
$\\ =40+ \left(\frac{20-12}{2(20)-12-11} \right).10 \\ \\ = 40 + \frac{8}{17}.10$
$= 44.70$
Thus, the Mode of the data is 44.70.
|
Statistics Class 10 Question Answers |
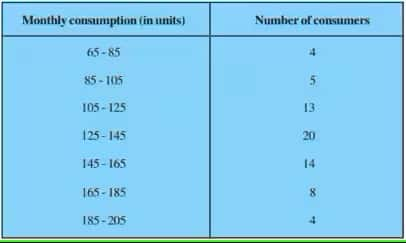
Answer:
Let the assumed mean be a = 130 and h = 20
|
Class |
Number of consumers $f_i$ |
Cumulative Frequency |
Classmark $x_i$ |
$d_i = x_i -a$ |
$u_i = \frac{d_i}{h}$ |
$f_iu_i$ |
|
65-85 |
4 |
4 |
70 |
-60 |
-3 |
-12 |
|
85-105 |
5 |
9 |
90 |
-40 |
-2 |
-10 |
|
105-125 |
13 |
22 |
110 |
-20 |
-1 |
-13 |
|
125-145 |
20 |
42 |
130 |
0 |
0 |
0 |
|
145-165 |
14 |
56 |
150 |
20 |
1 |
14 |
|
165-185 |
8 |
64 |
170 |
40 |
2 |
16 |
|
185-205 |
4 |
68 |
190 |
60 |
3 |
12 |
|
|
|
$\sum f_i = N$ = 68 |
|
|
|
$\sum f_iu_i$ = 7 |
MEDIAN:
$N= 68$
$⇒\frac{N}{2} = 34$
$\therefore$ Median class = 125-145; Cumulative Frequency = 42; Lower limit, l = 125;
c.f. = 22; f = 20; h = 20
$Median = l + \left (\frac{\frac{n}{2}-c.f}{f} \right ).W$
$\\ = 125 + \left (\frac{34-22}{20} \right ).20 \\ \\ = 125 + 12$
$= 137$
Thus, the median of the data is 137
MODE:
The class with the maximum frequency is the modal class.
The maximum frequency is 20, and hence the modal class = 125-145
Lower limit (l) of modal class = 125, class size (h) = 20
Frequency ( $f_1$ ) of the modal class = 20; frequency ( $f_0$ ) of class preceding the modal class = 13, frequency ( $f_2$ ) of class succeeding the modal class = 14.
$Mode = l + \left(\frac{f_1-f_0}{2f_1 - f_0 - f_2} \right).h$
$\\ = 125 + \left(\frac{20-13}{2(20)-13-14} \right).20 \\ \\ = 125 + \frac{7}{13}.20$
$= 135.76$
Thus, the Mode of the data is 135.76
MEAN:
Mean,
$\overline x =a + \frac{\sum f_iu_i}{\sum f_i}\times h$
$= 130 + \frac{7}{68}\times20 = 137.05$
Thus, the Mean of the data is 137.05.
Q2: If the median of the distribution given below is 28.5, find the values of x and y.
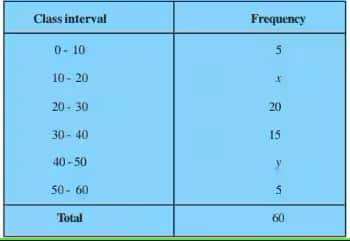
Answer:
|
Class |
Number of consumers $f_i$ |
Cumulative Frequency |
|
0-10 |
5 |
5 |
|
10-20 |
x |
5+x |
|
20-30 |
20 |
25+x |
|
30-40 |
15 |
40+x |
|
40-50 |
y |
40+x+y |
|
50-60 |
5 |
45+x+y |
|
|
$\sum f_i = N$ = 60 |
|
$N= 60$
$⇒\frac{N}{2} = 30$
Now,
Given median = 28.5, which lies in the class 20-30
Therefore, Median class = 20-30
The frequency corresponding to the median class, f = 20
Cumulative frequency of the class preceding the median class, c.f. = 5 + x
Lower limit, l = 20; Class height, h = 10
$Median = l + \left (\frac{\frac{n}{2}-c.f}{f} \right ).W$
$\\ \implies28.5= 20 + \left (\frac{30-5-x}{20} \right ).10 \\ \\ \implies8.5=\frac{25-x}{2} \\ \implies 25-x = 8.5(2) \\ \implies x = 25 - 17 = 8$
Also,
$\\ 60 = 45 + x+y \\ \implies x+y = 60-45 = 15 \\ \implies y = 15-x = 15-8 \ \ \ (\because x =8) \\ \implies y = 7$
Therefore, the required values are: x = 8 and y = 7.
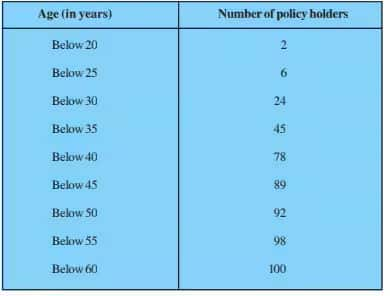
Answer:
|
Class |
Frequency $f_i$ |
Cumulative Frequency |
|
15-20 |
2 |
2 |
|
20-25 |
4 |
6 |
|
25-30 |
18 |
24 |
|
30-35 |
21 |
45 |
|
35-40 |
33 |
78 |
|
40-45 |
11 |
89 |
|
45-50 |
3 |
92 |
|
50-55 |
6 |
98 |
|
55-60 |
2 |
100 |
$N= 100$
$⇒\frac{N}{2} = 50$
Therefore, Median class = 35-45
The frequency corresponding to the median class, f = 21
Cumulative frequency of the class preceding the median class, c.f. = 24
Lower limit, l = 35; Class height, h = 10
$Median = l + \left (\frac{\frac{n}{2}-c.f}{f} \right ).W$
$\\ = 35 + \left (\frac{50-45}{33} \right ).5 \\ \\$
$= 35.75$
Thus, the median age is 35.75 years.
Find the median length of the leaves.
(Hint: The data needs to be converted to continuous classes to find the median since the formula assumes continuous classes. The classes then change to
117.5 - 126.5, 126.5 - 135.5, . . ., 171.5 - 180.5.)
Answer:
The data needs to be converted to continuous classes to find the median since the formula assumes continuous classes.
|
Class |
Frequency $f_i$ |
Cumulative Frequency |
|
117.5-126.5 |
3 |
3 |
|
126.5-135.5 |
5 |
8 |
|
135.5-144.5 |
9 |
17 |
|
144.5-153.5 |
12 |
29 |
|
153.5-162.5 |
5 |
34 |
|
162.5-171.5 |
4 |
38 |
|
171.5-180.5 |
2 |
40 |
$ N= 40$
$⇒\frac{N}{2} = 20$
Therefore, Median class = 144.5-153.5
Lower limit, l = 144.5; Class height, h = 9
Frequency corresponding to median class, f = 12
Cumulative frequency of the class preceding the median class, c.f. = 17
$Median = l + \left (\frac{\frac{n}{2}-c.f}{f} \right ).W$
$\\ = 144.5 + \left (\frac{20-17}{12} \right ).9 \\ \\$
$= 146.75$
Thus, the median length of the leaves is 146.75 mm.
Q5: The following table gives the distribution of the lifetime of 400 neon lamps :
Find the median lifetime of a lamp.
Answer:
|
Class |
Frequency $f_i$ |
Cumulative Frequency |
|
1500-2000 |
14 |
14 |
|
2000-2500 |
56 |
70 |
|
2500-3000 |
60 |
130 |
|
3000-3500 |
86 |
216 |
|
3500-4000 |
74 |
290 |
|
4000-4500 |
62 |
352 |
|
4500-5000 |
48 |
400 |
$N= 400$
$⇒\frac{N}{2} = 200$
Therefore, Median class = 3000-3500
Lower limit, l = 3000; Class height, h = 500
Frequency corresponding to median class, f = 86
Cumulative frequency of the class preceding the median class, c.f. = 130
$Median = l + \left (\frac{\frac{n}{2}-c.f}{f} \right ).W$
$\\ = 3000 + \left (\frac{200-130}{86} \right ).500 \\ \\ = 3000+406.97=3406.97$
Thus, the median lifetime of a lamp is 3406.97 hours.
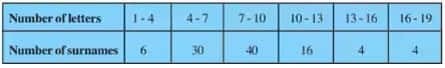
Answer:
|
Class |
Number of surnames $f_i$ |
Cumulative Frequency |
Classmark $x_i$ |
$f_ix_i$ |
|
1-4 |
6 |
6 |
2.5 |
15 |
|
4-7 |
30 |
36 |
5.5 |
165 |
|
7-10 |
40 |
76 |
8.5 |
340 |
|
10-13 |
16 |
92 |
11.5 |
184 |
|
13-16 |
4 |
96 |
14.5 |
51 |
|
16-19 |
4 |
100 |
17.5 |
70 |
|
|
|
$\sum f_i = N$ = 100 |
|
$\sum f_ix_i$ = 825 |
MEDIAN:
$N= 100 $
$⇒\frac{N}{2} = 50$
$\therefore$ Median class = 7-10; Lower limit, l = 7;
Cumulative frequency of preceding class, c.f. = 36; f = 40; h = 3
$Median = l + \left (\frac{\frac{n}{2}-c.f}{f} \right ).W$
$=7+\left(\frac{50-36}{40}\right) \cdot 3$
$= 8.05$
Thus, the median of the data is 8.05
MODE:
The class with the maximum frequency is the modal class.
The maximum frequency is 40, and hence the modal class = 7-10
Lower limit (l) of modal class = 7, class size (h) = 3
Frequency ( $f_1$ ) of the modal class = 40; frequency ( $f_0$ ) of class preceding the modal class = 30, frequency ( $f_2$ ) of class succeeding the modal class = 16
$Mode = l + \left(\frac{f_1-f_0}{2f_1 - f_0 - f_2} \right).h$
$\\ = 7 + \left(\frac{40-30}{2(40)-30-16} \right).3 \\ \\ = 125 + \frac{10}{34}.3$
$= 7.88$
Thus, the Mode of the data is 7.88
MEAN:
Mean,
$\overline x =\frac{\sum f_ix_i}{\sum f_i}$
$= \frac{825}{100} = 8.25$
Thus, the Mean of the data is 8.25.
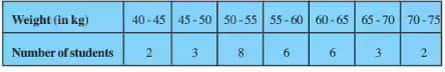
Answer:
|
Class |
Number of students $f_i$ |
Cumulative Frequency |
|
40-45 |
2 |
2 |
|
45-50 |
3 |
5 |
|
50-55 |
8 |
13 |
|
55-60 |
6 |
19 |
|
60-65 |
6 |
25 |
|
65-70 |
3 |
28 |
|
70-75 |
2 |
30 |
MEDIAN:
$N= 30 $
$⇒\frac{N}{2} = 15$
$\therefore$ Median class = 55-60; Lower limit, l = 55;
Cumulative frequency of preceding class, c.f. = 13; f = 6; h = 5
$Median = l + \left (\frac{\frac{n}{2}-c.f}{f} \right ).W$
$= 55+ \left (\frac{15-13}{6} \right ).5 $
$ = 55+\frac{2}{6}.5$
$= 56.67$
Thus, the median weight of the students is 56.67 kg.
Get your results instantly with our calculator!
Exercise-wise NCERT Solutions of Statistics Class 10 Maths Chapter 13 are provided in the links below.
Question:
Calculate the mean from the following table.
| Scores | Frequencies |
| 0-10 | 2 |
| 10-20 | 4 |
| 20-30 | 12 |
| 30-40 | 21 |
| 40-50 | 6 |
| 50-60 | 3 |
| 60-70 | 2 |
Answer:
The formula for the mean ($X$) using the method of assumed mean is:
$X = A + \frac{\sum fd}{\sum f}$ where $A$ is assumed mean, $f$ is frequency, and $d$ is deviation from mean.
The assumed mean ($A$) is usually taken as the midpoint of the middle class. In this case, it's 35.
The midpoints of the score ranges are 5, 15, 25, 35, 45, 55, and 65.
The frequencies are 2, 4, 12, 21, 6, 3, and 2.
| Midpoint ($x$) | Frequency($f$) | Deviation ($d = x - A$) | $fd$ |
| 5 | 2 | –30 | –60 |
| 15 | 4 | –20 | –80 |
| 25 | 12 | –10 | –120 |
| 35 | 21 | 0 | 0 |
| 45 | 6 | 10 | 60 |
| 55 | 3 | 20 | 60 |
| 65 | 2 | 30 | 60 |
| $\sum f$ = 50 | $\sum fd$ = –80 |
The formula for the mean ($X$) using the method of assumed mean is:
$X = A + \frac{\sum fd}{\sum f}$
⇒ $X = 35 + \frac{-80}{50} = 33.4$
Hence, the correct answer is 33.4.
Students will explore the following topics in NCERT Class 10 Maths Chapter 13 Statistics:
Measures of Central Tendency - Mean, Median, and Mode:
$X = \frac{\sum (f_{i}x_i)}{\sum f_i}$
Where '$f_i$' denotes the frequency of the value '$x_i$'.
Assumed Mean Method: Alternatively, the mean can be calculated using the Assumed Mean Method:
$X =a+ \frac{\sum (f_{i}d_i)}{\sum f_i}$
Where '$a$' is an assumed mean and '$d_i$' is the deviation of each value '$x_i$' from the assumed mean.
Step Deviation Method: Another approach is the Step Deviation Method:
$X =a+ [\frac{\sum (f_{i}u_i)}{\sum f_i}]\times h$
Where '$u_i$' represents the step deviations and '$h$' is the class interval.
The median is the central value in a set of observations, and its calculation depends on the number of observations.
For an odd number of observations,
Median = Value of the $\frac{(n+1)}2$th term in the ordered set
In the case of an even number of observations
Median = average of the values of the two middle terms
Median for grouped data
Median $= l + \left (\frac{\frac{n}{2}-c.f}{f} \right ).h$
Where,
$l$ = lower limit of the median class
$c.f $ = Cumulative frequency of preceding class
$f$ = Frequency of median class
$h$ = class interval
The mode represents the value that appears most frequently in a dataset.
The formula to calculate the mode is:
Mode $= l + \left(\frac{f_1-f_0}{2f_1 - f_0 - f_2} \right).h$
Where,
$l$ = lower limit of the modal class
$f_1$ = frequency of the modal class
$f_0$ = frequency of the class before the modal class
$f_2$ = frequency of the class after the modal class
$h$ = Class interval
Empirical formula
Mode = 3 Median - 2 Mean
Understanding statistics helps us make sense of numbers in real life, such as marks, surveys, or averages. It builds our skills to collect, organise, and study data properly. These Class 10 Maths chapter 13 Statistics question answers help us learn these ideas step by step. Here are some more points on why these question answers are important:
We at Careers360 compiled all the NCERT class 10 Maths solutions in one place for easy student reference. The following links will allow you to access them.
Also, read,
Here is the latest NCERT syllabus, which is very useful for students before strategising their study plans.
Also, links to some reference books which are important for further studies.
You can find NCERT Exemplar Solutions for Maths as well as Science through the given links.
Frequently Asked Questions (FAQs)
There are three methods – the Direct Method, the Assumed Mean Method, and the Step Deviation Method. Each helps calculate the mean, depending on the size and values of the data.
The median helps find the middle value of a data set, useful for calculating average income, age, or marks when the data is unevenly distributed.
They are Mean, Median, and Mode. These help in summarising data through a single representative value.
Yes. Many questions in several state boards, including CBSE Class 10 board exams, come directly or indirectly from NCERT exercises. Practising these solutions ensures better accuracy and speed in exams.
You can easily download free PDFs of NCERT Solutions for Class 10 Maths Statistics from reliable educational websites such as Careers360 for offline study.
In Class 10 Statistics, the mean is the average of all values, the median is the middle value when the data is arranged in order from smallest to largest, and the mode is the value that appears most frequently.
Statistics is widely used in real life to analyse and interpret data. From calculating averages in cricket scores to understanding survey results, this chapter lays a strong foundation for data handling and further studies. Also, NCERT Solutions for Class 10 Maths Chapter 13 Statistics are very important not only for the Class 10 board exam but also for higher classes.
The following topics are covered in NCERT Class 10 Maths Chapter 13:
1. Mean for grouped and ungrouped data.
2. Direct method to find the mean.
3. Method of assumed mean to find the mean.
4. Step deviation method to find the mean.
5. Median for grouped and ungrouped data.
6. Mode for grouped and ungrouped data.

On Question asked by student community
Dear Student,
The first phase of the CBSE Class 10th 2026 LOC submission has ended on March 31, 2026. As per the notice, CBSE has set April 16 to April 20, 2026, as the main period for schools to submit the LOC and pay the exam fees .
Check for
Hi,
You can access the CM Shri School question paper in the link given below.
Hi Rakshit Sharma,
Here are CBSE Class 10 Question Papers 2026 and previous year question papers for your reference:
https://school.careers360.com/boards/cbse/cbse-class-10-question-paper-2026
https://school.careers360.com/boards/cbse/cbse-previous-year-question-papers-class-10
https://school.careers360.com/boards/cbse/cbse-previous-year-question-papers
Dear Student,
If you have filled the wrong bubble on the ORM sheet in the CBSE Class 10 board but the roll number is correct, it is considered a minor error.
If your roll number is correct, your sheet may still be evaluated and you can check your marks using
Hi Student
The total annual expenditure for Class X boarding for all events depends on which school you are opting for. The school's reputation, facilities provided to the students, and location play an important role. The expenses include boarding, lodging, tuition fees, accommodation, meals, etc.
A block of mass 0.50 kg is moving with a speed of 2.00 ms-1 on a smooth surface. It strikes another mass of 1.00 kg and then they move together as a single body. The energy loss during the collision is
| Option 1)
|
Option 2)
|
| Option 3)
|
Option 4)
|
An athlete in the olympic games covers a distance of 100 m in 10 s. His kinetic energy can be estimated to be in the range
| Option 1)
|
Option 2)
|
| Option 3)
|
Option 4)
|
A particle is projected at 600 to the horizontal with a kinetic energy . The kinetic energy at the highest point
| Option 1)
|
Option 2)
|
| Option 3)
|
Option 4)
|
In the reaction,
| Option 1)
|
Option 2)
|
| Option 3)
|
Option 4)
|
How many moles of magnesium phosphate, will contain 0.25 mole of oxygen atoms?
| Option 1)
0.02 |
Option 2)
3.125 × 10⁻² |
| Option 3)
1.25 × 10⁻² |
Option 4)
2.5 × 10⁻² |
Enrol for Aakash Re-NEET 2026 Victory Batch at Rs. 99 only. Batch start 16th May.
Study at a world-renowned UK university in India | Admissions open for UG & PG programs.
Apply for UG & PG programmes from Victoria University, Delhi NCR Campus
Admissions open for UG & PG programs at Illinois Tech Mumbai
Apply for UG & PG courses at University of Aberdeen, Mumbai Campus
UG & PG Admissions open for CS/AI/Business/Economics & other programmes.