NCERT Solutions for Exercise 14.2 Class 10 Maths Chapter 14 - Statistics
Knowledge about data patterns in grouped data formats enables better interpretation of real-world trends in the data. This part of the chapter explores mode as a central tendency measure used to determine the most recurrent value in a dataset. The mode is crucial in statistical assessment, especially when data exists in interval groups. We evaluate patterns in the most recurring data points by utilising graphical and algebraic tools in this research. This exercise demonstrates to students how to calculate the mode for grouped data by using an appropriate formula.
This Story also Contains
- NCERT Solutions Class 10 Maths Chapter 13 Exercise 13.2
- Assess NCERT Solutions for Class 10 Maths Chapter 13 Exercise 13.2
- Topics Covered in Chapter 13 Statistics: Exercise 13.2
- NCERT Solutions for Class 10 Subject Wise
- NCERT Exemplar Solutions of Class 10 Subject Wise
The NCERT Solutions featured here apply to the latest version of National Council of Educational Research and Training books from the 2025–2026 school year. The solutions guide students to break down the procedure of locating the modal class, then use the proper formula to find the mode. Knowledge mastery of this topic enables students to apply their learned skills in economic research and healthcare, and social science investigations because they need to find and understand dominant patterns. The exercise functions as an essential tool for solidifying the knowledge described in NCERT Books.
Assess NCERT Solutions for Class 10 Maths Chapter 13 Exercise 13.2
Q1 The following table shows the ages of the patients admitted in a hospital during a year:
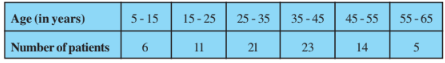
Find the mode and the mean of the data given above. Compare and interpret the two measures of central tendency.
Answer:
To find the modal class: The class having the maximum frequency is the modal class. And, the maximum frequency is 23, and hence the modal class = 35-45
Thus, Lower limit (l) of modal class = 35, class size (h) = 10
Frequency (
Frequency (
Frequency (
Therefore,
Now,
Age | Number of patients | Classmark | |
5-15 | 6 | 10 | 60 |
15-25 | 11 | 20 | 220 |
25-35 | 21 | 30 | 630 |
35-45 | 23 | 40 | 920 |
45-55 | 14 | 50 | 700 |
55-65 | 5 | 60 | 300 |
=80 | =2830 |
Mean,
Therefore, the maximum number of patients is in the age group of 36.8, whereas the average age of all the patients is 35.37.
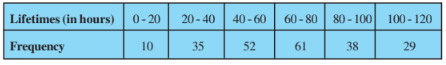
Determine the modal lifetimes of the components.
Answer:
To find the modal class: The class having the maximum frequency is the modal class. And, the maximum frequency is 61, and hence the modal class = 60-80
Thus, Lower limit (l) of modal class = 60, class size (h) = 20
Frequency (
Frequency (
Frequency (
Therefore,
Thus, the modal lifetime of 225 electrical components is 65.62 hours
Answer:
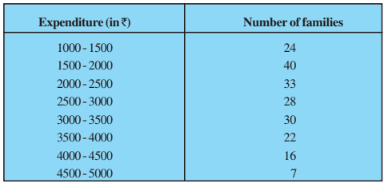
To find the modal class: The class having the maximum frequency is the modal class. And, the maximum frequency is 40, and hence the modal class = 1500-2000
Thus, Lower limit (l) of modal class = 1500, class size (h) = 500
Frequency (
Frequency (
Frequency (
Therefore,
Thus, the Mode of the data is Rs. 1847.82
Now,
Let the assumed mean be a = 2750 and h = 500
Expenditure | Number of families | Classmark | | | |
1000-1500 | 24 | 1250 | -1500 | -3 | -72 |
1500-2000 | 40 | 1750 | -1000 | -2 | -80 |
2000-2500 | 33 | 2250 | -500 | -1 | -33 |
2500-3000 | 28 | 2750 | 0 | 0 | 0 |
3000-3500 | 30 | 3250 | 500 | 1 | 30 |
3500-4000 | 22 | 3750 | 1000 | 2 | 44 |
4000-4500 | 16 | 4250 | 1500 | 3 | 48 |
4500-5000 | 7 | 4750 | 2000 | 4 | 28 |
=200 | = -35 |
Mean,
Thus, the Mean monthly expenditure is Rs. 2662.50
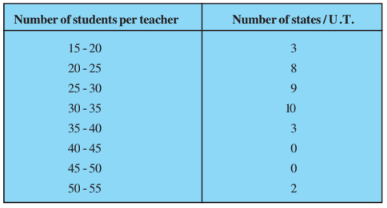
Answer:
To find the modal class: The class having the maximum frequency is the modal class. And, the maximum frequency is 10, and hence the modal class = 30-35
Lower limit (l) of modal class = 30, class size (h) = 5
Frequency (
Frequency (
Frequency (
Therefore,
Thus, the Mode of the data is 30.625
Now,
Let the assumed mean be a = 32.5 and h = 5
Class | Number of states | Classmark | | | |
15-20 | 3 | 17.5 | -15 | -3 | -9 |
20-25 | 8 | 22.5 | -10 | -2 | -16 |
25-30 | 9 | 27.5 | -5 | -1 | -9 |
30-35 | 10 | 32.5 | 0 | 0 | 0 |
35-40 | 3 | 37.5 | 5 | 1 | 3 |
40-45 | 0 | 42.5 | 10 | 2 | 0 |
45-50 | 0 | 47.5 | 15 | 3 | 0 |
50-55 | 2 | 52.5 | 20 | 4 | 8 |
=35 | = -23 |
Mean,
Thus, the Mean of the data is 29.22
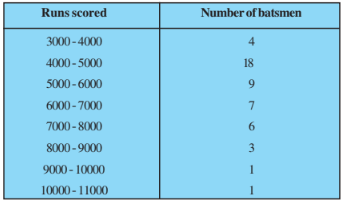
Find the mode of the data.
Answer:
To find the modal class: The class having the maximum frequency is the modal class. And, the maximum frequency is 18, and hence the modal class = 4000-5000
Lower limit (l) of modal class = 4000, class size (h) = 1000
Frequency (
Frequency (
Frequency (
Therefore,
Thus, the Mode of the data is 4608.70
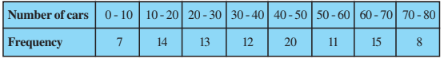
Answer:
To find the modal class: The class having the maximum frequency is the modal class. And, the maximum frequency is 20, and hence the modal class = 40-50
Lower limit (l) of modal class = 40, class size (h) = 10
Frequency (
Frequency (
Frequency (
Therefore,
Thus, the Mode of the data is 44.70
Also Read-
Topics Covered in Chapter 13 Statistics: Exercise 13.2
1. Understanding Mode for Grouped Data: Learning Mode for Grouped Data shows how this statistical value represents the dominant entry, which occurs most often, especially when data is grouped into intervals.
2. Identifying the Modal Class: A practical method to discover the Modal Class describes the procedure for identifying the class interval with maximum frequency, as it serves as the foundation for calculating the mode.
3. Applying the Mode Formula: Statistical calculation of mode requires the lower class limit of the modal interval alongside the interval width and counts from the modal group, together with adjacent classes.
4. Solving Real-Life Based Word Problems: Students will solve real-life based word problems using frequency tables that originate from survey results or performance scores to establish the most common outcome.
5. Interpreting Data Trends: Those who master the ability to examine organised frequency distributions can form substantial conclusions from original data patterns.
Check Out-
NCERT Solutions for Class 10 Subject Wise
Students must check the NCERT solutions for class 10 of the Mathematics and Science Subjects.
NCERT Exemplar Solutions of Class 10 Subject Wise
Students must check the NCERT Exemplar solutions for class 10 of the Mathematics and Science Subjects.
Frequently Asked Questions (FAQs)
Q: How can we measure central tendency of a data as covered in NCERT solutions for Class 10 Maths exercise 14.2?
A:
These concepts are discussed ex 14.2 class 10 comprehensively. With the help of mode , median and mean we can measure central tendency of a data. Practice this exercise to command these concepts.
Q: What do you mean by multimodal data ?
A:
These concepts are discussed in class 10 maths ex 14.2 . The data which have more than one value which are repeated in same frequency are called multimodal data. Practice the problems to command these concepts.
Q: What do you mean by modal class ?
A:
These concepts are discussed in 10th class maths exercise 14.2 answers. Modal class is the class which have maximum frequency or we can say that the class which has highest occurring value in the data. Practice these problems to command the concepts.
Q: Explain the variables covered in the formula of finding mode in grouped data according to NCERT book Class 10 Maths exercise 14.2 .
A:
l = modal class's lowest limit
h = denotes the length of the class interval (assuming all class sizes to be equal)
f ₁ =represents the frequency of the modal class
f ₀ =represents the frequency of the class preceding the modal class
f ₂ = represents the frequency of the class following the modal class.
Q: How many questions are there in Class 10 Maths exercise 14.2 ?
A:
There are six questions in class 10 ex 14.2. Practice these problems to command the concepts.
Q: What do you mean by central tendency ?
A:
This ex 14.2 class 10 discuss about the concept of Central tendency refers to the centre value of all observations.
Q: How many solved examples are there before Exercise 14.2 Class 10 Maths that are based on the mode of grouped data?
A:
There are three problems based on the nature of root that are solved before the Class 10 Mathematics chapter 14 exercise 14.2.
Articles
Related Stories
|
Upcoming School Exams

Certifications By Top Providers
Explore Top Universities Across Globe
Questions related to CBSE Class 10th
On Question asked by student community
Have a question related to CBSE Class 10th ?
HELLO,
I am attaching the link through which you can download and access the Bangalore Sahodaya Class 10th CBSE question paper of Mathematics ( Basic )
Here is the link :- https://school.careers360.com/download/ebooks/bangalore-sahodaya-class-10-mathematics-basic-question-paper-2025-26
It will help you to practice basic level numerical questions, strengthen fundamentals and prepare confidently for the board
HELLO,
Below i am attaching the direct link of Careers360 through which you can download the Bangalore Sahodaya Class 10th Mathematics Basic Question paper 2025 2026
Here is the link :- https://school.careers360.com/download/ebooks/bangalore-sahodaya-class-10-mathematics-basic-question-paper-2025-26
Hope this will help you!
Hello
You will be able to download the CBSE Class 10th Maths Sample Paper 2025-26 using the link which is given below.
https://school.careers360.com/boards/cbse/cbse-10th-maths-sample-papers-2025-26
I hope this information helps you.
Thank you.
Hello,
Here you can access the last 5 years CBSE Class 10 Board Exam Question Papers from the mentioned link below:
https://school.careers360.com/boards/cbse/cbse-previous-year-question-papers-class-10
Hope it helps.
You can check the Class 11 English half yearly question paper and answer key for 2025 26 on the Careers360 website. These papers help students practice, understand the exam pattern, and check their answers for better preparation.
You can visit this Careers360 link to access the English question paper and
Popular CBSE Class 10th Questions
A block of mass 0.50 kg is moving with a speed of 2.00 ms-1 on a smooth surface. It strikes another mass of 1.00 kg and then they move together as a single body. The energy loss during the collision is
| Option 1)
|
Option 2)
|
| Option 3)
|
Option 4)
|
An athlete in the olympic games covers a distance of 100 m in 10 s. His kinetic energy can be estimated to be in the range
| Option 1)
|
Option 2)
|
| Option 3)
|
Option 4)
|
A particle is projected at 600 to the horizontal with a kinetic energy . The kinetic energy at the highest point
| Option 1)
|
Option 2)
|
| Option 3)
|
Option 4)
|
In the reaction,
| Option 1)
|
Option 2)
|
| Option 3)
|
Option 4)
|
How many moles of magnesium phosphate, will contain 0.25 mole of oxygen atoms?
| Option 1)
0.02 |
Option 2)
3.125 × 10⁻² |
| Option 3)
1.25 × 10⁻² |
Option 4)
2.5 × 10⁻² |
Colleges After 12th
Applications for Admissions are open.
As per latest syllabus. Physics formulas, equations, & laws of class 11 & 12th chapters
JEE Main Important Chemistry formulas
Get nowAs per latest syllabus. Chemistry formulas, equations, & laws of class 11 & 12th chapters
JEE Main high scoring chapters and topics
Get nowAs per latest 2024 syllabus. Study 40% syllabus and score upto 100% marks in JEE
JEE Main Important Mathematics Formulas
Get nowAs per latest syllabus. Maths formulas, equations, & theorems of class 11 & 12th chapters
CBSE Class 10th Notifications
Never miss CBSE Class 10th update
Get timely CBSE Class 10th updates directly to your inbox. Stay informed!