JEE Main Important Physics formulas
As per latest syllabus. Physics formulas, equations, & laws of class 11 & 12th chapters


Statistics enables us to understand real-life data through interpretation of collected information. This field in mathematics handles the process of gathering numerical data followed by visual or analytical interpretation to reveal statistical patterns. The exercise works with grouped data together with frequency distribution patterns to analyze large statistical information. The procedure of grouping data followed by counting the number of occurrences in each category enables us to find significant patterns.
This Story also Contains
The NCERT Solutions for Exercise 13.1 represent unprocessed data through grouped frequency tables. The frequency tables demonstrate to students which values occur in which intervals. The exercise challenges students to convert raw data into structured forms which lays a foundation for computing mean, median and mode values in future assignments. The exercise functions as an essential tool for knowledge described in NCERT Books which leads to complete understanding of problems and their practical applications.
Which method did you use for finding the mean, and why?
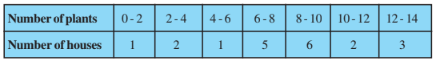
Number of plants | Number of houses | Classmark | |
0-2 | 1 | 1 | 1 |
2-4 | 2 | 3 | 6 |
4-6 | 1 | 5 | 5 |
6-8 | 5 | 7 | 35 |
8-10 | 6 | 9 | 54 |
10-12 | 2 | 11 | 22 |
12-14 | 3 | 13 | 39 |
=20 | =162 |
Mean,
We used the direct method in this as the values of
Q2 Consider the following distribution of daily wages of 50 workers of a factory. Find the mean daily wages of the workers of the factory by using an appropriate method.
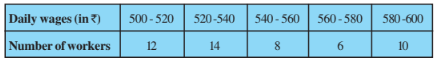
Let the assumed mean be a = 550
Daily Wages | Number of workers | Classmark | | |
500-520 | 12 | 510 | -40 | -480 |
520-540 | 14 | 530 | -20 | -280 |
540-560 | 8 | 550 | 0 | 0 |
560-580 | 6 | 570 | 20 | 120 |
580-600 | 10 | 590 | 40 | 400 |
= 50 | = -240 |
Mean,
Therefore, the mean daily wages of the workers of the factory is Rs. 545.20
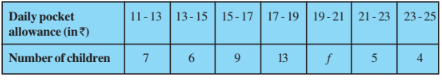
Daily pocket allowance | Number of children | Classmark | |
11-13 | 7 | 12 | 84 |
13-15 | 6 | 14 | 84 |
15-17 | 9 | 16 | 144 |
17-19 | 13 | 18 | 234 |
19-21 | f | 20 | 20f |
21-23 | 5 | 22 | 110 |
23-25 | 4 | 24 | 96 |
=44+f | =752+20f |
Mean,
Therefore the missing f = 20
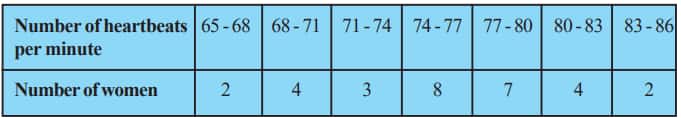
Let the assumed mean be a = 75.5
No. of heartbeats per minute | Number of women | Classmark | | |
65-68 | 2 | 66.5 | -9 | -18 |
68-71 | 4 | 69.5 | -6 | -24 |
71-74 | 3 | 72.5 | -3 | -9 |
74-77 | 8 | 75.5 | 0 | 0 |
77-80 | 7 | 78.5 | 3 | 21 |
80-83 | 4 | 81.5 | 6 | 24 |
83-86 | 2 | 84.5 | 9 | 18 |
=30 | =12 |
Mean,
Therefore, the mean heartbeats per minute of these women are 75.9
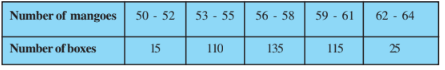
Find the mean number of mangoes kept in a packing box. Which method of finding the mean did you choose?
Let the assumed mean be a = 57
Number of mangoes | Number of boxes | Classmark | | |
50-52 | 15 | 51 | -6 | -90 |
53-55 | 110 | 54 | -3 | -330 |
56-58 | 135 | 57 | 0 | 0 |
59-61 | 115 | 60 | 3 | 345 |
62-64 | 25 | 63 | 6 | 150 |
=400 | =75 |
Mean,
Therefore, the mean number of mangoes kept in a packing box is approx 57.19
Q6 The table below shows the daily expenditure on the food of 25 households in a locality. Find the mean daily expenditure on food by a suitable method.
Daily expenditure in rupees | 100-150 | 150-200 | 200-250 | 250-300 | 300-350 |
| Number of households | 4 | 5 | 12 | 2 | 2 |
Let the assumed mean be a = 225 and h = 50
Daily Expenditure | Number of households | Classmark | | | |
100-150 | 4 | 125 | -100 | -2 | -8 |
150-200 | 5 | 175 | -50 | -1 | -5 |
200-250 | 12 | 225 | 0 | 0 | 0 |
250-300 | 2 | 275 | 50 | 1 | 2 |
300-350 | 2 | 325 | 100 | 2 | 4 |
=25 | = -7 |
Mean,
Therefore, the mean daily expenditure on food is Rs. 211
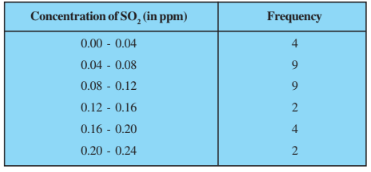
Find the mean concentration of
Class Interval | Frequency | Classmark | |
0.00-0.04 | 4 | 0.02 | 0.08 |
0.04-0.08 | 9 | 0.06 | 0.54 |
0.08-0.12 | 9 | 0.10 | 0.90 |
0.12-0.16 | 2 | 0.14 | 0.28 |
0.16-0.20 | 4 | 0.18 | 0.72 |
0.20-0.24 | 2 | 0.22 | 0.44 |
=30 | =2.96 |
Mean,
Therefore, the mean concentration of
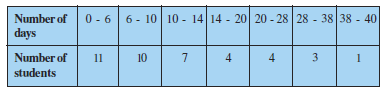
Number of days | Number of Students | Classmark | |
0-6 | 11 | 3 | 33 |
6-10 | 10 | 8 | 80 |
10-14 | 7 | 12 | 84 |
14-20 | 4 | 17 | 68 |
20-28 | 4 | 24 | 96 |
28-38 | 3 | 33 | 99 |
38-40 | 1 | 39 | 39 |
=40 | =499 |
Mean,
Therefore, the mean number of days a student was absent is 12.48 days.
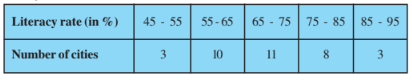
Let the assumed mean be a = 75 and h = 10
Literacy rates | Number of cities | Classmark | | | |
45-55 | 3 | 50 | -20 | -2 | -6 |
55-65 | 10 | 60 | -10 | -1 | -10 |
65-75 | 11 | 70 | 0 | 0 | 0 |
75-85 | 8 | 80 | 10 | 1 | 8 |
85-95 | 3 | 90 | 20 | 2 | 6 |
= 35 | = -2 |
Mean,
Therefore, the mean mean literacy rate is 69.43%
Also Read-
1. Grouped Frequency Distribution: A person must learn to convert extensive raw data into classification intervals combined with frequency counts that produce better reading metrics.
2. Mid-point Method: The average calculation for grouped data requires using the midpoints from class intervals to estimate the central value.
3. Mean of Grouped Data: The formula Mean = (∑fx) / ∑f applies to calculate grouped data average while recognizing f as the frequency and x as the class mark (midpoint).
4. Data Interpretation: The skill involves understanding real-world data followed by tabular structure implementation for better analysis purposes.
5. Practical Understanding of Statistics: Data handling abilities prove essential in practical conditions like budgeting surveys and planning and budget processes.
Check Out-
Get your results instantly with our calculator!
Students must check the NCERT Exemplar solutions for class 10 of the Mathematics and Science Subjects.
Frequently Asked Questions (FAQs)
To find what is the basics of statistic. Definition of mean and its formula. To learn about different methods of finding mean like Assumed mean method, step deviation method etc. Go through the ex 14.1 class 10 to command these concepts.
The mean (average) of a data set is found by adding all numbers in the data set and then dividing by the number of values in the set. Practice class 10 maths ex 14.1 to command these concepts.
The class midpoint (or class mark) is a specific point in the centre of the bins (categories) in a frequency distribution table. Go through exercise 14.1 class 10 maths to get deeper understanding of concepts.
This class 10 ex 14.1 discusses the concept of mean in detail. to find mean of data use formula discussed in this exercise. mean = sum of total data / number of data
The centre of a bar in a histogram is known as class mark.
The mean of the data will also increase by 5.

On Question asked by student community
Hello Ananya,
Please specify the class for which you need the question papers. I am providing Class 10 and 12 papers.
Here are the links to the CBSE Half-yearly Question Papers (2025-2026).
Hello Ananya,
Please specify the class for which you need the question papers. I am providing Class 10 and 12 papers.
Here are the links to the CBSE Half-yearly Question Papers (2025-2026).
Hi Sujal,
Please refer to this article link
https://school.careers360.com/boards/cbse/cbse-class-10-science-last-5-years-question-papers
Hello Pawan,
CBSE Class 10 Mathematics 2026 and previous year question paper:
https://school.careers360.com/boards/cbse/cbse-class-10-question-paper-2026
CBSE Class 12 Mathematics 2026 and previous year question paper:
https://school.careers360.com/boards/cbse/cbse-previous-year-question-papers-class-12-maths
Hello Krishna,
The CBSE Class 10 English previous year question papers with answers are available in PDF format for the last 5 years at the link given below. These papers help practice authentic board exam questions, improve answer writing, and understand the exam pattern.
https://school.careers360.com/boards/cbse/cbse-class-10-english-last-5-years-question-papers
A block of mass 0.50 kg is moving with a speed of 2.00 ms-1 on a smooth surface. It strikes another mass of 1.00 kg and then they move together as a single body. The energy loss during the collision is
| Option 1)
|
Option 2)
|
| Option 3)
|
Option 4)
|
An athlete in the olympic games covers a distance of 100 m in 10 s. His kinetic energy can be estimated to be in the range
| Option 1)
|
Option 2)
|
| Option 3)
|
Option 4)
|
A particle is projected at 600 to the horizontal with a kinetic energy . The kinetic energy at the highest point
| Option 1)
|
Option 2)
|
| Option 3)
|
Option 4)
|
In the reaction,
| Option 1)
|
Option 2)
|
| Option 3)
|
Option 4)
|
How many moles of magnesium phosphate, will contain 0.25 mole of oxygen atoms?
| Option 1)
0.02 |
Option 2)
3.125 × 10⁻² |
| Option 3)
1.25 × 10⁻² |
Option 4)
2.5 × 10⁻² |
Study at a world-renowned UK university in India | Admissions open for UG & PG programs.
Apply for UG & PG programmes from Victoria University, Delhi NCR Campus
Admissions open for UG & PG programs at Illinois Tech Mumbai
Apply for UG & PG courses at University of Aberdeen, Mumbai Campus
UG & PG Admissions open for CS/AI/Business/Economics & other programmes.
Bristol's expertise meets Mumbai's innovation. Admissions open for UG & PG programmes