

NCERT Solutions for Class 11 Maths Chapter 5 Linear Inequalities
Our life is full of comparisons, as in many situations, we have to face the greater-than or less-than scenarios. From minimum wages and financial budgets to maximum speed limits, Linear Inequalities play a very important role in decision-making. From the latest NCERT syllabus for class 11, the chapter Linear Inequalities contains the concepts of inequalities in one variable, inequalities in two variables, and how to solve them using graphs or linear representation. Understanding these concepts will make students more efficient in solving problems involving inequalities and improve their algebraic skills. The main focus of the NCERT Solutions for Class 11 is to make learning simpler and easier for students.
This Story also Contains
- NCERT Solutions for Class 11 Maths Chapter 5 Linear Inequalities: Download Free PDF
- NCERT Solutions for Class 11 Maths Chapter 5 Linear Inequalities: Exercise Questions
- Linear Inequalities Class 11 NCERT Solutions: Exercise-wise
- Class 11 Maths NCERT Chapter 5: Extra Question
- Linear Inequalities Class 11 Chapter 5: Topics
- Linear Inequalities Class 11 Solutions: Important Formulae
- Approach to Solve Questions of Linear Inequalities Class 11
- What Extra Should Students Study Beyond the NCERT for JEE
- Why are Class 11 Maths Chapter 5 Linear Inequalities question answers important?
- NCERT Solutions for Class 11 Maths: Chapter Wise
This article on NCERT Solutions for Class 11 Maths Chapter 5 Linear Inequalities offers clear and step-by-step solutions for the exercise problems in the NCERT Class 11 Maths Book. Students who require Linear Inequalities class 11 solutions will find this article very useful. These Class 11 Linear Inequalities NCERT solutions are made by the experienced Subject Matter Experts at Careers360 following the latest guidelines, ensuring that students can grasp the basic concepts effectively. Many teachers also recommend NCERT Solutions because they help students prepare according to exam requirements.
NCERT Solutions for Class 11 Maths Chapter 5 Linear Inequalities: Download Free PDF
The NCERT Solutions for Class 11 Maths Chapter 5 have been prepared by Careers360 experts to make learning simpler and to help you score better in exams. Students can download the complete PDF from the link provided below.
NCERT Solutions for Class 11 Maths Chapter 5 Linear Inequalities: Exercise Questions
Below, you will find the NCERT Class 11 Maths Chapter 5 Linear Inequalities question answers explained step by step.
| Linear Inequalities Class 11 Question Answers Exercise: 5.1 Page Number: 95-96 Total Questions: 26 |
Question 1(i): Solve $24x < 100$ , when $x$ is a natural number.
Answer:
Given : $24x < 100$
$\Rightarrow$ $24x < 100$
Divide by 24 from both sides
$\Rightarrow \, \, \, \frac{24}{24}x< \frac{100}{24}$
$\Rightarrow \, \, \, x< \frac{25}{6}$
$\Rightarrow \, \, \, x< 4.167$
$x$ is a natural number which is less than 4.167.
Hence, values of x can be $\left \{ 1,2,3,4 \right \}$
Question 1(ii): Solve $24x< 100$ , when
$x$ is an integer.
Answer:
Given : $24x < 100$
$\Rightarrow$ $24x < 100$
Divide by 24 from both sides
$\Rightarrow \, \, \, \frac{24}{24}x< \frac{100}{24}$
$\Rightarrow \, \, \, x< \frac{25}{6}$
$\Rightarrow \, \, \, x< 4.167$
$x$ is an integer which is less than 4.167.
Hence, values of x can be $\left \{..........-3,-2,-1,0, 1,2,3,4 \right \}$
Question 2(i): Solve $-12x>30$ , when
x is a natural number.
Answer:
Given : $-12x>30$
$\Rightarrow$ $-12x>30$
Divide by -12 from both sides
$\Rightarrow \, \, \, \frac{-12}{-12}x< \frac{30}{-12}$
$\Rightarrow \, \, \, x< \frac{30}{-12}$
$\Rightarrow \, \, \, x< -2.5$
$x$ is a natural number which is less than - 2.5.
Hence, the values of x do not exist for the given inequality.
Question 2(ii): Solve $- 12x > 30$ , when $x$ is an integer.
Answer:
Given : $-12x>30$
$\Rightarrow$ $-12x>30$
Divide by -12 from both sides
$\Rightarrow \, \, \, \frac{-12}{-12}x< \frac{30}{-12}$
$\Rightarrow \, \, \, x< \frac{30}{-12}$
$\Rightarrow \, \, \, x< -2.5$
$x$ are integers less than - 2.5.
Hence, values of x can be $\left \{ .............,-6,-5,-4,-3 \right \}$
Question 3(i): Solve $5x - 3 < 7$ , when $x$ is an integer.
Answer:
Given : $5x - 3 < 7$
$\Rightarrow$ $5x - 3 < 7$
$\Rightarrow \, \, \, 5x< 10$
Divide by 5 from both sides
$\Rightarrow \, \, \, \frac{5}{5}x< \frac{10}{5}$
$\Rightarrow \, \, \, x< 2$
$x$ is an integer less than 2.
Hence, values of x can be $\left \{.........-3,-2-1,0,1,\right \}$
Question 3(ii): Solve $5x - 3 < 7$ , when $x$ is a real number.
Answer:
Given : $5x - 3 < 7$
$\Rightarrow$ $5x - 3 < 7$
$\Rightarrow \, \, \, 5x< 10$
Divide by 5 from both sides
$\Rightarrow \, \, \, \frac{5}{5}x< \frac{10}{5}$
$\Rightarrow \, \, \, x< 2$
$x$ are real numbers less than 2.
i.e. $x\in (-\infty ,2)$
Question 4(i): Solve $3x + 8 >2$ , when
x is an integer.
Answer:
Given : $3x + 8 >2$
$\Rightarrow$ $3x + 8 >2$
$\Rightarrow \, \, \, 3x> -6$
Divide by 3 from both sides
$\Rightarrow \, \, \, \frac{3}{3}x> \frac{-6}{3}$
$\Rightarrow \, \, \, x> - 2$
$x$ are integers greater than -2.
Hence, the values of x can be $\left \{-1,0,1,2,3,4...............\right \}$.
Question 4(ii): Solve $3x + 8 >2$ , when $x$ is a real number. )
Answer:
Given : $3x + 8 >2$
$\Rightarrow$ $3x + 8 >2$
$\Rightarrow \, \, \, 3x> -6$
Divide by 3 from both sides
$\Rightarrow \, \, \, \frac{3}{3}x> \frac{-6}{3}$
$\Rightarrow \, \, \, x> - 2$
$x$ are real numbers greater than -2
Hence , values of x can be as $x\in (-2,\infty )$
Question 5: Solve the inequality for real $x$.
Answer:
Given : $4x + 3 < 5x + 7$
$\Rightarrow$$4x + 3 < 5x + 7$
$\Rightarrow \, \, \, 4x-5x< 7-3$
$\Rightarrow \, \, \, x> -4$
$x$ are real numbers greater than -4.
Hence, values of x can be as $x\in (-4 ,\infty )$
Question 6: Solve the inequality for real $x$
Answer:
Given : $3x - 7 > 5x -1$
$\Rightarrow$$3x - 7 > 5x -1$
$\Rightarrow \, \, \, -2x> 6$
$\Rightarrow \, \, \, x< \frac{6}{-2}$
$\Rightarrow \, \, \, x< -3$
$x$ are real numbers less than -3.
Hence, values of x can be $x\in (-\infty ,-3)$
Question 7: Solve the inequality for real $x$.
Answer:
Given : $3(x-1) \leq 2(x-3)$
$\Rightarrow$$3(x-1) \leq 2(x-3)$
$\Rightarrow \, \, \, 3x-3\leq 2x-6$
$\Rightarrow \, \, \, 3x-2x\leq -6+3$
$\Rightarrow \, \, \, x\leq -3$
$x$ are real numbers less than or equal to -3.
Hence , values of x can be as , $x\in (-\infty ,-3]$
Question 8: Solve the inequality for real $x$
Answer:
Given : $3(2- x) \geq 2(1-x)$
$\Rightarrow$$3(2- x) \geq 2(1-x)$
$\Rightarrow \, \, \, 6-3x\geq 2-2x$
$\Rightarrow \, \, \, 6-2\geq 3x-2x$
$\Rightarrow \, \, \, 4\geq x$
$x$ are real numbers less than or equal to 4.
Hence, values of x can be as $x\in (-\infty ,4]$
Question 9: Solve the inequality for real $x$
$x + \frac{x}{2} + \frac{x}{3} < 11$
Answer:
Given : $x + \frac{x}{2} + \frac{x}{3} < 11$
$\Rightarrow$$x + \frac{x}{2} + \frac{x}{3} < 11$
$\Rightarrow \, \, \, x(1+\frac{1}{2}+\frac{1}{3})< 11$
$\Rightarrow \, \, \, x(\frac{11}{6})< 11$
$\Rightarrow \, \, \, 11 x< 11\times 6$
$\Rightarrow \, \, \, x< 6$
$x$ are real numbers less than 6.
Hence, values of x can be as $x\in (-\infty ,6)$
Question 10: Solve the inequality for real $x$.
$\frac{x}{3} > \frac{x}{2} + 1$
Answer:
Given : $\frac{x}{3} > \frac{x}{2} + 1$
$\Rightarrow$$\frac{x}{3} > \frac{x}{2} + 1$
$\Rightarrow \, \, \, \frac{x}{3}-\frac{x}{2}> 1$
$\Rightarrow \, \, \,x (\frac{1}{3}-\frac{1}{2})> 1$
$\Rightarrow \, \, \,x (-\frac{1}{6})> 1$
$\Rightarrow \, \, \, -x > 6$
$\Rightarrow \, \, \, x< -6$
$x$ are real numbers less than -6.
Hence, values of x can be as $x\in (-\infty ,-6)$
Question 11: Solve the inequality for real $x$
$\frac{3(x-2)}{5} \leq \frac{5(2-x)}{3}$
Answer:
Given : $\frac{3(x-2)}{5} \leq \frac{5(2-x)}{3}$
$\Rightarrow$$\frac{3(x-2)}{5} \leq \frac{5(2-x)}{3}$
$\Rightarrow \, \, \, 9(x-2)\leq 25(2-x)$
$\Rightarrow \, \, \, 9x-18\leq 50-25x$
$\Rightarrow \, \, \, 9x+25x\leq 50+18$
$\Rightarrow \, \, \, 34x\leq 68$
$\Rightarrow \, \, \, x\leq 2$
$x$ are real numbers less than or equal to 2.
Hence, values of x can be as $x\in (-\infty ,2]$
Question 12: Solve the inequality for real $x$
$\frac{1}{2}\left(\frac{3x}{5} + 4 \right ) \geq \frac{1}{3}(x - 6)$
Answer:
Given : $\frac{1}{2}\left(\frac{3x}{5} + 4 \right ) \geq \frac{1}{3}(x - 6)$
$\Rightarrow$$\frac{1}{2}\left(\frac{3x}{5} + 4 \right ) \geq \frac{1}{3}(x - 6)$
$\Rightarrow \, \, 3\left(\frac{3x}{5} + 4 \right ) \geq 2(x - 6)$
$\Rightarrow \, \, \frac{9x}{5} + 12 \geq 2x-12$
$\Rightarrow \, \, 12+12 \geq 2x-\frac{9x}{5}$
$\Rightarrow \, \, 24 \geq \frac{x}{5}$
$\Rightarrow \, \, 120 \geq x$
$x$ are real numbers less than or equal to 120.
Hence, values of x can be as $x\in (-\infty,120 ]$ .
Question 13: Solve the inequality for real $x$
Answer:
Given : $2(2x + 3) - 10 < 6(x-2)$
$\Rightarrow$$2(2x + 3) - 10 < 6(x-2)$
$\Rightarrow \, \, \, 4x+6-10 < 6x-12$
$\Rightarrow \, \, \, 6-10+12 < 6x-4x$
$\Rightarrow \, \, \, 8 < 2x$
$\Rightarrow \, \, \, 4 < x$
$x$ are real numbers greater than 4
Hence , values of x can be as $x\in (4,\infty )$
Question 14: Solve the inequality for real $x$
$37 - (3x + 5) \geq 9x - 8(x-3)$
Answer:
Given : $37 - (3x + 5) \geq 9x - 8(x-3)$
$\Rightarrow$$37 - (3x + 5) \geq 9x - 8(x-3)$
$\Rightarrow \, \, \, 37 - 3x - 5 \geq 9x - 8x+24$
$\Rightarrow \, \, \, 32 - 3x \geq x+24$
$\Rightarrow \, \, \, 32 - 24 \geq x+3x$
$\Rightarrow \, \, \, 8 \geq 4x$
$\Rightarrow \, \, \, 2\geq x$
$x$ are real numbers less than or equal to 2.
Hence , values of x can be as $x\in (-\infty ,2]$
Question 15: Solve the inequality for real x
$\frac{x}{4}< \frac{(5x-2)}{3} - \frac{(7x-3)}{5}$
Answer:
Given : $\frac{x}{4}< \frac{(5x-2)}{3} - \frac{(7x-3)}{5}$
$\Rightarrow$ $\frac{x}{4}< \frac{(5x-2)}{3} - \frac{(7x-3)}{5}$
$\Rightarrow \, \, \, \, 15x< 20(5x-2)-12(7x-3)$
$\Rightarrow \, \, \, \, 15x< 100x-40-84x+36$
$\Rightarrow \, \, \, \, 15x< 16x-4$
$\Rightarrow \, \, \, \, 4< x$
$x$ are real numbers greater than 4.
Hence, values of x can be as $x\in (4,\infty)$
Question 16: Solve the inequality for real $x$
$\frac{(2x - 1)}{3} \geq \frac{3x-2}{4} - \frac{(2-x)}{5}$
Answer:
Given : $\frac{(2x - 1)}{3} \geq \frac{3x-2}{4} - \frac{(2-x)}{5}$
$\Rightarrow$$\frac{(2x - 1)}{3} \geq \frac{3x-2}{4} - \frac{(2-x)}{5}$
$\Rightarrow \, \, \, 20(2x - 1) \geq 15(3x-2) - 12(2-x)$
$\Rightarrow \, \, \, 40x - 20 \geq 45x-30 - 24+12x$
$\Rightarrow \, \, \, 30+24 - 20 \geq 45x-40x+12x$
$\Rightarrow \, \, \, 34 \geq 17x$
$\Rightarrow \, \, \, 2 \geq x$
$x$ are real numbers less than or equal to 2.
Hence, values of x can be as $x\in (-\infty,2 ]$ .
Question 17: Solve the inequality and show the graph of the solution on number line $3x - 2 < 2x + 1$
Answer:
Given : $3x - 2 < 2x + 1$
$\Rightarrow$$3x - 2 < 2x + 1$
$\Rightarrow \, \, \, 3x - 2x< 2 + 1$
$\Rightarrow \, \, \, x< 3$
$x$ are real numbers less than 3
Hence, values of x can be as $x\in (-\infty ,3)$
The graphical representation of solutions of the given inequality is as :

Question 18: Solve the inequality and show the graph of the solution on the number line $5x - 3 \geq 3x -5$
Answer:
Given : $5x - 3 \geq 3x -5$
$\Rightarrow$$5x - 3 \geq 3x -5$
$\Rightarrow \, \, \, 5x - 3x \geq 3 -5$
$\Rightarrow \, \, \, 2x \geq -2$
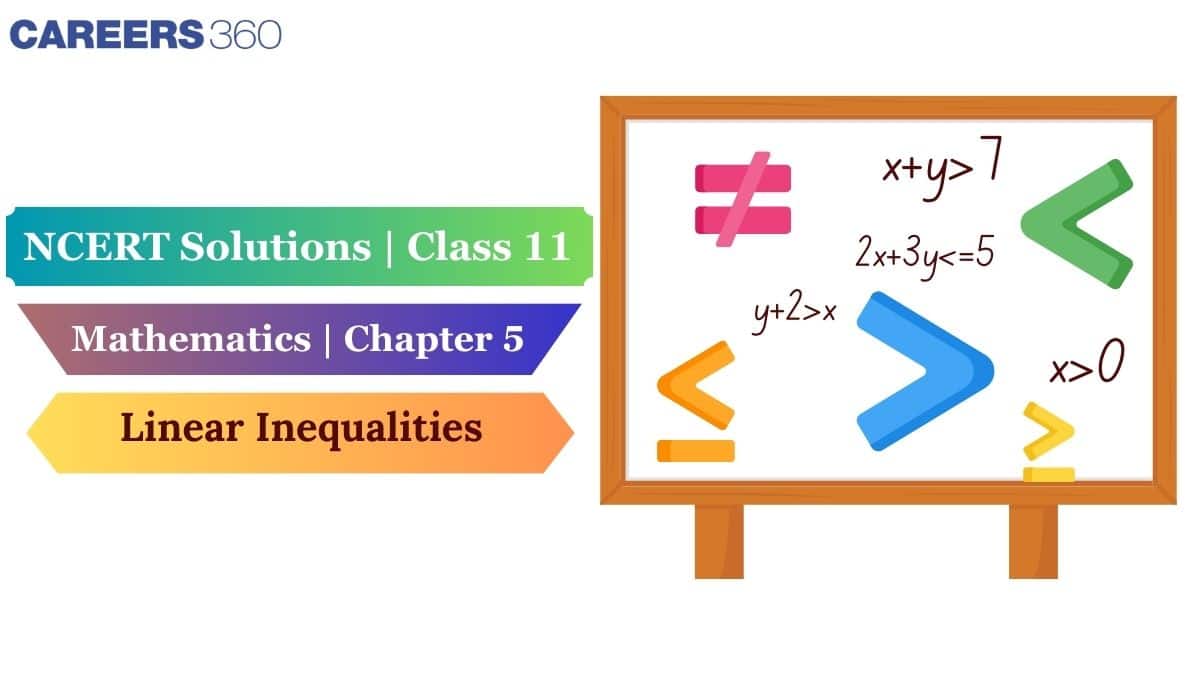
$\Rightarrow \, \, \, x \geq -1$
$x$ are real numbers greater than or equal to -1.
Hence, values of x can be as $x\in [-1,\infty )$
The graphical representation of the solutions of the given inequality is as follows:
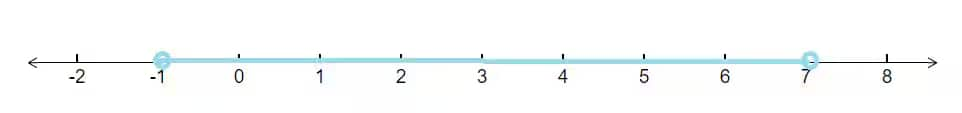
Question 19: Solve the inequality and show the graph of the solution on number line $3(1-x) < 2 (x +4)$
Answer:
Given : $3(1-x) < 2 (x +4)$
$\Rightarrow$$3(1-x) < 2 (x +4)$
$\Rightarrow \, \, \, 3- 3x< 2x + 8$
$\Rightarrow \, \, \, 3- 8< 2x + 3x$
$\Rightarrow \, \, \, -5< 5 x$
$\Rightarrow \, \, \, -1< x$
$x$ are real numbers greater than -1
Hence, values of x can be as $x\in (-1,\infty )$
The graphical representation of the solutions of the given inequality is as follows:

Question 20: Solve the inequality and show the graph of the solution on the number line $\frac{x}{2} \geq \frac{(5x-2)}{3} - \frac{(7x-3)}{5}$
Answer:
Given : $\frac{x}{2} \geq \frac{(5x-2)}{3} - \frac{(7x-3)}{5}$
$\Rightarrow$$\frac{x}{2} \geq \frac{(5x-2)}{3} - \frac{(7x-3)}{5}$
$\Rightarrow \, \, \, 15x \geq 10(5x-2) - 6(7x-3)$
$\Rightarrow \, \, \, 15x \geq 50x-20 - 42x+18$
$\Rightarrow \, \, \, 15x+42x-50x \geq 18-20$
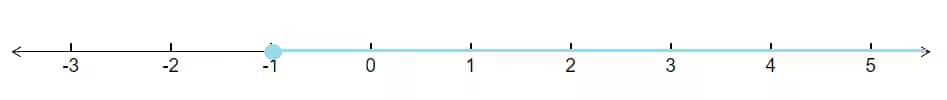
$\Rightarrow \, \, \, 7x \geq -2$
$\Rightarrow \, \, \, x \geq \frac{-2}{7}$
$x$ are real numbers greater than equal to $= \frac{-2}{7}$
Hence, values of x can be as $x\in (-\frac{2}{7},\infty )$
The graphical representation of the solutions of the given inequality is as follows:
Answer:
Let x be the marks obtained by Ravi in the third test.
The student should have an average of at least 60 marks.
$\therefore \, \, \, \frac{70+75+x}{3}\geq 60$
$\, \, \, 145+x\geq 180$
$x\geq 180-145$
$x\geq 35$
The student should have a minimum of 35 marks to have an average of 60
Answer:
Sunita’s marks in the first four examinations are 87, 92, 94 and 95.
Let x be the marks obtained in the fifth examination.
To receive a Grade ‘A’ in a course, one must obtain an average of 90 marks or more in five examinations.
$\therefore \, \, \, \frac{87+92+94+95+x}{5}\geq 90$
$\Rightarrow \, \, \, \frac{368+x}{5}\geq 90$
$\Rightarrow \, \, \, 368+x\geq 450$
$\Rightarrow \, \, \, x\geq 450-368$
$\Rightarrow \, \, \, x\geq 82$
Thus, Sunita must obtain 82 in the fifth examination to get a grade ‘A’ in the course.
Answer:
Let x be the smaller of two consecutive odd positive integers. Then the other integer is x+2.
Both integers are smaller than 10.
$\therefore \, \, \, x+2< 10$
$\Rightarrow \, \, \, \, x< 10-2$
$\Rightarrow \, \, \, \, x< 8$
The sum of both integers is more than 11.
$\therefore \, \, \, x+(x+2)> 11$
$\Rightarrow \, \, \, (2x+2)> 11$
$\Rightarrow \, \, \, 2x> 11-2$
$\Rightarrow \, \, \, 2x> 9$
$\Rightarrow \, \, \, x> \frac{9}{2}$
$\Rightarrow \, \, \, x> 4.5$
We conclude $\, \, \, \, x< 8$ and $\, \, \, x> 4.5$ and x is odd integer number.
x can be 5,7.
The two pairs of consecutive odd positive integers are $(5,7)\, \, \, and\, \, \, (7,9)$ .
Answer:
Let x be the smaller of two consecutive even positive integers. Then the other integer is x+2.
Both integers are larger than 5.
$\therefore \, \, \, x> 5$
Sum of both integers is less than 23.
$\therefore \, \, \, x+(x+2)< 23$
$\Rightarrow \, \, \, (2x+2)< 23$
$\Rightarrow \, \, \, 2x< 23-2$
$\Rightarrow \, \, \, 2x< 21$
$\Rightarrow \, \, \, x< \frac{21}{2}$
$\Rightarrow \, \, \, x< 10.5$
We conclude $\, \, \, \, x< 10.5$ and $\, \, \, x> 5$ and x is even integer number.
x can be 6,8,10.
The pairs of consecutive even positive integers are $(6,8),(8,10),(10,12)$.
Answer:
Let the length of the smallest side be x cm.
Then the largest side = 3x cm.
Third side = 3x-2 cm.
Given: The perimeter of the triangle is at least 61 cm.
$\therefore\, \, \, x+3x+(3x-2)\geq 61$
$\Rightarrow \, \, \, 7x-2\geq 61$
$\Rightarrow \, \, \, 7x\geq 61+2$
$\Rightarrow \, \, \, 7x\geq 63$
$\Rightarrow \, \, \, x\geq \frac{63}{7}$
$\Rightarrow \, \, \, x\geq 9$
Minimum length of the shortest side is 9 cm.
[ Hint: If x is the length of the shortest board, then $x$, $(x + 3)$ and $2x$ are the lengths of the second and third pieces, respectively. Thus, $x + (x + 3) + 2x \leq 91$ and $2x \geq (x + 3) + 5$ ].
Answer:
Let x be the length of the shortest board,
Then $(x + 3)$ and $2x$ are the lengths of the second and third pieces, respectively.
The man wants to cut three lengths from a single piece of board of length 91cm.
Thus, $x + (x + 3) + 2x \leq 91$
$4x+3\leq 91$
$\Rightarrow \, \, \, \, 4x\leq 91-3$
$\Rightarrow \, \, \, \, 4x\leq 88$
$\Rightarrow \, \, \, \, x\leq \frac{88}{4}$
$\Rightarrow \, \, \, \, x\leq 22$
If the third piece is to be at least 5cm longer than the second, then
$2x \geq (x + 3) + 5$
$\Rightarrow \, \, \, \, 2x\geq x+8$
$\Rightarrow \, \, \, \, 2x-x\geq 8$
$\Rightarrow \, \, \, \, x\geq 8$
We conclude that $\, \, \, \, x\geq 8$ and $\, \, \, \, x\leq 22$ .
Thus , $8\leq x\leq 22$ .
Hence, the length of the shortest board is greater than or equal to 8 cm and less than or equal to 22 cm.
| Linear Inequalities Class 11 Question Answers Miscellaneous Exercise Page number: 98-99 Total questions: 14 |
Question 1: Solve the inequality $2\leq 3x-4\leq5$
Answer:
Given : $2\leq 3x-4\leq5$
$2\leq 3x-4\leq5$
$\Rightarrow\, \, 2+4\leq 3x\leq 5+4$
$\Rightarrow\, \, 6\leq 3x\leq 9$
$\Rightarrow\, \, \frac{6}{3}\leq x\leq \frac{9}{3}$
$\Rightarrow\, \, 2\leq x\leq 3$
Thus, all the real numbers greater than or equal to 2 and less than or equal to 3 are solutions to this inequality.
Solution set is $[2,3]$
Question 2: Solve the inequality $6 \leq -3(2x - 4) < 12$
Answer:
Given $6 \leq -3(2x - 4) < 12$
$6 \leq -3(2x - 4) < 12$
$\Rightarrow\, \ \frac{6}{3}\leq -(2x-4)< \frac{12}{3}$
$\Rightarrow\, \ -2\geq (2x-4)> -4$
$\Rightarrow\, \ -2+4\geq 2x> -4+4$
$\Rightarrow\, \ 2\geq 2x> 0$
$\Rightarrow\, \ 1\geq x> 0$
Solution set is $(01]$
Question 3: Solve the inequality $-3 \leq 4 - \frac{7x}{2}\leq 18$
Answer:
Given $-3 \leq 4 - \frac{7x}{2}\leq 18$
$\Rightarrow \, \, -3 \leq 4 - \frac{7x}{2}\leq 18$
$\Rightarrow \, \, -3-4 \leq - \frac{7x}{2}\leq 18-4$
$\Rightarrow \, \, -7 \leq - \frac{7x}{2}\leq 14$
$\Rightarrow \, \, 7 \geq \frac{7x}{2} \geq -14$
$\Rightarrow \, \, 7\times 2 \geq 7x\geq -14\times 2$
$\Rightarrow \, \, 14 \geq 7x \geq -28$
$\Rightarrow \, \, \frac{14}{7} \geq x \geq \frac{-28}{7}$
$\Rightarrow \, \, 2 \geq x \geq -4$
Solution set is $[-4,2]$
Question 4: Solve the inequality $-15 < \frac{3(x-2)}{5} \leq 0$
Answer:
Given the inequality
$-15 < \frac{3(x-2)}{5} \leq 0$
$-15 < \frac{3(x-2)}{5} \leq 0$
$\Rightarrow\, \ -15\times 5< 3(x-2)\leq 0\times 5$
$\Rightarrow\, \ -75< 3(x-2)\leq 0$
$\Rightarrow\, \ \frac{-75}{3}< (x-2)\leq \frac{0}{3}$
$\Rightarrow\, \ -25< (x-2)\leq 0$
$\Rightarrow\, \ -25+2< x\leq 0+2$
$\Rightarrow\, \ -23< x\leq 2$
The solution set is $(-23,2]$
Question 5: Solve the inequality $-12<4-\frac{3x}{-5} \leq 2$
Answer:
Given the inequality
$-12<4-\frac{3x}{-5} \leq 2$
$-12<4-\frac{3x}{-5} \leq 2$
$\Rightarrow\, \, -12-4< -\frac{3x}{-5}\leq 2-4$
$\Rightarrow\, \, -16< -\frac{3x}{-5}\leq -2$
$\Rightarrow\, \, -16< \frac{3x}{5}\leq -2$
$\Rightarrow\, \, -16\times 5< 3x\leq -2\times 5$
$\Rightarrow\, \, -80< 3x\leq -10$
$\Rightarrow\, \, \frac{-80}{3}< 3x\leq \frac{-10}{3}$
Solution set is $(\frac{-80}{3}, \frac{-10}{3}]$
Question 6: Solve the inequality $7 \leq \frac{(3x+ 11)}{2}\leq 11$
Answer:
Given the linear inequality
$7 \leq \frac{(3x+ 11)}{2}\leq 11$
$7 \leq \frac{(3x+ 11)}{2}\leq 11$
$\Rightarrow \, \, 7\times 2 \leq (3x+ 11)\leq 11\times 2$
$\Rightarrow \, \, 14 \leq (3x+ 11)\leq 22$
$\Rightarrow \, \, 14-11 \leq (3x)\leq 22-11$
$\Rightarrow \, \, 3 \leq 3x\leq 11$
$\Rightarrow \, \, 1 \leq x\leq \frac{11}{3}$
The solution set of the given inequality is $[1,\frac{11}{3}]$
Question 7: Solve the inequality and represent the solution graphically on number line. $5x + 1 > -24,\ 5x - 1 <24$
Answer:
Given : $5x + 1 > -24,\ 5x - 1 <24$
$5x + 1 > -24\, \, \, \, \, \, \, and\, \, \, \, \, \, \ 5x - 1 <24$
$\Rightarrow 5x > -24-1\, \, \, \, \, \, \, and\, \, \, \, \, \, \ 5x <24+1$
$\Rightarrow 5x > -25\, \, \, \, \, \, \, and\, \, \, \, \, \, \ 5x <25$
$\Rightarrow x > \frac{-25}{5}\, \, \, \, \, \, \, and\, \, \, \, \, \, \ x <\frac{25}{5}$
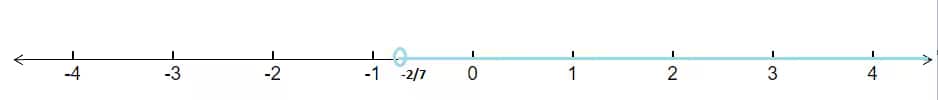
$\Rightarrow x > -5\, \, \, \, \, \, \, and\, \, \, \, \, \, \ x <5$
$(-5,5)$
The solution graphically on the number line is as shown :
Question 8: Solve the inequality and represent the solution graphically on number line. $2(x-1)<x+5,\ 3(x+2)> 2 -x$
Answer:
Given : $2(x-1)<x+5,\ 3(x+2)> 2 -x$
$2(x-1)<x+5\, \, \, \, and\, \, \, \, \, \ 3(x+2)> 2 -x$
$\Rightarrow \, \, 2x-2<x+5\, \, \, \, and\, \, \, \, \, \ 3x+6> 2 -x$
$\Rightarrow \, \, 2x-x<2+5\, \, \, \, and\, \, \, \, \, \ 3x+x> 2 -6$
$\Rightarrow \, \, x<7\, \, \, \, and\, \, \, \, \, \ 4x> -4$
$\Rightarrow \, \, x<7\, \, \, \, and\, \, \, \, \, \ x> -1$
$(-1,7)$
The solution graphically on the number line is as shown :
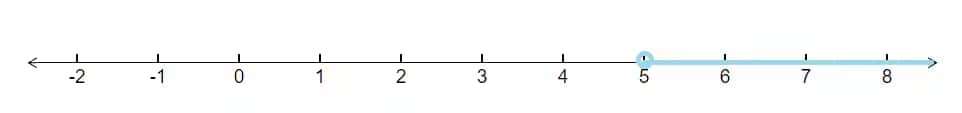
Question 9: Solve the inequality and represent the solution graphically on number line. $3x - 7 > 2(x-6),\ 6-x > 11 - 2x$
Answer:
Given : $3x - 7 > 2(x-6),\ 6-x > 11 - 2x$
$3x - 7 > 2(x-6)\, \, \, \, and\, \, \, \, \, \ 6-x > 11 - 2x$
$\Rightarrow \, \, 3x - 7 > 2x-12\, \, \, \, and\, \, \, \, \, \ 6-x > 11 - 2x$
$\Rightarrow \, \, 3x - 2x >7-12\, \, \, \, and\, \, \, \, \, \ 2x-x > 11 - 6$
$\Rightarrow \, \, x >-5\, \, \, \, and\, \, \, \, \, \ x > 5$
$x\in (5,\infty )$
The solution graphically on the number line is as shown :
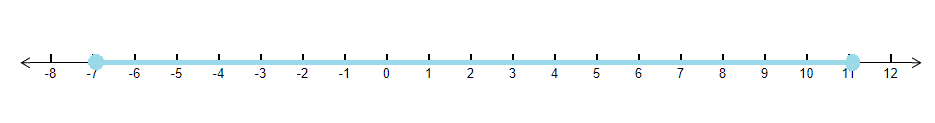
Question 10: Solve the inequality and represent the solution graphically on number line.
$5(2x-7)-3(2x+3)\leq 0,\quad 2x + 19 \leq 6x +47$
Answer:
Given : $5(2x-7)-3(2x+3)\leq 0,\quad 2x + 19 \leq 6x +47$
$5(2x-7)-3(2x+3)\leq 0\, \, \, \, \, and\, \, \, \, \, \, \, \quad 2x + 19 \leq 6x +47$
$\Rightarrow \, \, 10x-35-6x-9\leq 0\, \, \, \, \, and\, \, \, \, \, \, \, \quad 2x -6x\leq 47-19$
$\Rightarrow \, \, 4x-44\leq 0\, \, \, \, \, and\, \, \, \, \, \, \, \quad -4x\leq 28$
$\Rightarrow \, \, 4x\leq 44\, \, \, \, \, and\, \, \, \, \, \, \, \quad 4x\geq - 28$
$\Rightarrow \, \, x\leq 11\, \, \, \, \, and\, \, \, \, \, \, \, \quad x\geq - 7$
$x\in [-7,11]$
The solution graphically on the number line is as shown :
Answer:
Since the solution is to be kept between 68° F and 77° F.
$68< F< 77$
Putting the value of $F = \frac{9}{5}C + 32$ , we have
$\Rightarrow \, \, \, 68< \frac{9}{5}C + 32< 77$
$\Rightarrow \, \, \, 68-32< \frac{9}{5}C < 77-32$
$\Rightarrow \, \, \, 36< \frac{9}{5}C < 45$
$\Rightarrow \, \, \, 36\times 5< 9C < 45\times 5$
$\Rightarrow \, \, \, 180< 9C < 225$
$\Rightarrow \, \, \, \frac{180}{9}< C < \frac{225}{9}$
$\Rightarrow \, \, \, 20< C < 25$
The range in temperature in degrees Celsius (C) is between 20 and 25.
Answer:
Let x litres of 2% boric acid solution be required to be added.
Total mixture = (x+640) litres
The resulting mixture is to be more than 4% but less than 6% boric acid.
$\therefore \, 2\%x+8\%\, of\, 640> 4\%\, of\, (640+x)$ and $2\%x+8\%\, of\, 640< 6\%\, of\, (x+640)$
$\Rightarrow \, 2\%x+8\%\, of\, 640> 4\%\, of\, (640+x)$ and $2\%x+8\%\, of\, 640< 6\%\, of\, (x+640)$
$\Rightarrow \, \frac{2}{100}x+(\frac{8}{100}) 640> \frac{4}{100} (640+x)$ and $ \, \frac{2}{100}x+(\frac{8}{100}) 640< \frac{6}{100} (640+x)$
$\Rightarrow \, 2x+5120> 4x+2560$ and $\, 2x+5120< 6x+3840$
$\Rightarrow \, 5120-2560> 4x-2x$ and $ \, 5120-3840< 6x-2x$
$\Rightarrow \, 2560> 2x$ and $ \, 1280< 4x$
$\Rightarrow \, 1280> x$ and $ \, 320< x$
So, $1280> x > 320$
Thus, the number of litres 2% of boric acid solution that is to be added will have to be more than 320 and less than 1280 litres.
Answer:
Let x litres of water be required to be added.
Total mixture = (x+1125) litres
It is evident that the amount of acid contained in the resulting mixture is 45% of 1125 litres.
The resulting mixture contains more than 25 % but less than 30% acid.
$\therefore \, 30\%\, of\, (1125+x) > 45\%\, of\, (1125)$ and $25\%\, of\, (1125+x)< 45\%\, of\, 1125$
$\Rightarrow \, 30\%\, of\, (1125+x) > 45\%\, of\, (1125)$ and $25\%\, of\, (1125+x)< 45\%\, of\, 1125$
$\Rightarrow \, \frac{30}{100}(1125+x)> \frac{45}{100} (1125)$ and $\, (\frac{25}{100}) (1125+x)< \frac{45}{100} (1125)$
$\Rightarrow \, 30\times 1125+30x> 45\times (1125)$ and $ \, 25 (1125+x)< 45(1125)$
$\Rightarrow \, 30x> (45-30)\times (1125)$ and $ \, 25 x< (45-25)1125$
$\Rightarrow \, 30x> (15)\times (1125)$ and $ \, 25 x< (20)1125$
$\Rightarrow \, x> \frac{15\times 1125}{30}$ and $ \, x< \frac{20\times 1125}{25}$
$\Rightarrow \, x> 562.5$ and $\, x< 900$
So, $900>x>562.5$
Thus, the number of litres of water that is to be added will have to be more than 562.5 and less than 900 litres.
Answer:
Given that the IQ of a group of 12-year-old children is:
$80\leq IQ\leq140$
For a group of 12-year-old children, CA =12 years
$IQ= \frac{MA}{CA}\times 100$
Putting the value of IQ, we obtain
$80\leq IQ\leq140$
$\Rightarrow \, \, 80\leq \frac{MA}{CA}\times 100\leq140$
$\Rightarrow \, \, 80\leq \frac{MA}{12}\times 100\leq140$
$\Rightarrow \, \, 80\times 12\leq MA\times 100\leq140\times 12$
$\Rightarrow \, \, \frac{80\times 12}{100}\leq MA\leq \frac{140\times 12}{100}$
$\Rightarrow \, \, 9.6\leq MA\leq 16.8$
Thus, the range of mental age of the group of 12-year-old children is $\, \, 9.6\leq MA\leq 16.8$.
Confused between CGPA and Percentage?
Get your results instantly with our calculator!
Linear Inequalities Class 11 NCERT Solutions: Exercise-wise
Exercise-wise NCERT Solutions of Linear Inequalities Class 11 Maths Chapter 5 are provided in the links below.
Class 11 Maths NCERT Chapter 5: Extra Question
Question:
If x is a real number and $\left | x \right | < 3$, then:
Solution:
Given: |x|< 3
Thus, there will be two cases,
x < 3 …… (i)
& x > -3 ….. (ii)
Thus, -3 < x < 3 …….. [From (i) & (ii)]
Hence, the correct answer is $-3\leq x\leq 3$.
Also, check,
Linear Inequalities Class 11 Chapter 5: Topics
Students will explore the following topics in NCERT Class 11 Maths Chapter 5 Linear Inequalities:
- Introduction
- Inequalities
- Algebraic Solutions of Linear Inequalities in One Variable and Their Graphical Representation
Linear Inequalities Class 11 Solutions: Important Formulae
Inequation (Inequality):
An inequation or inequality is a statement involving variables and the sign of inequality, like $>,<, \geq, \leq$.
Symbols used in inequalities:
The symbol < means less than.
The symbol > means greater than.
The symbol < with a bar underneath ≤ means less than or equal to.
The symbol > with a bar underneath ≥ means greater than or equal to.
The symbol ≠ means the quantities on the left and right sides are not equal.
Algebraic Solutions for Linear Inequalities in One Variable:
Linear inequalities involve expressions with variables and inequality symbols like $>,<, \geq,\neq$.
The solution to a linear inequality can be determined using algebraic methods.
Important rules to follow when solving linear inequalities:
-
Rule 1: Don’t change the sign of an inequality by adding or subtracting the same integer on both sides of an equation.
-
Rule 2: Add or subtract the same positive integer from both sides of an inequality equation.
Graphical Representation of Linear Inequalities:
Linear inequalities can also be represented graphically on a number line.
For example, $x > 3$ represents all real numbers greater than 3, which can be shaded on the number line to the right of 3.
Similarly, $x ≤ -2$ represents all real numbers less than or equal to -2, which can be shaded on the number line to the left of -2.
Approach to Solve Questions of Linear Inequalities Class 11
Using these approaches, students can tackle the Linear Inequalities Class 11 Chapter 5 Question Answers with greater confidence.
- Get familiar with the basic definitions and symbols such as $>,<, \geq,\neq$.
- Remember that the inequality sign gets reversed if it is multiplied or divided by a negative number.
- Try to represent the solution interval on a number line to visualise and confirm the solution range.
- Break down complex inequality problems into two separate inequalities and solve them individually.
- For compound inequalities like $a<x<b$, solve each inequality separately and find the intersection (common region) of solution sets later.
- For inequalities involving polynomials or rational expressions, test points from different intervals to determine where the inequality holds.
What Extra Should Students Study Beyond the NCERT for JEE
Here is a comparison list of the concepts in Linear Inequalities that are covered in JEE and NCERT, to help students understand what extra they need to study beyond the NCERT for JEE:
|
Concept Name |
JEE |
NCERT |
|
✅ |
✅ | |
|
✅ | ❌ | |
|
✅ | ❌ |
Why are Class 11 Maths Chapter 5 Linear Inequalities question answers important?
This chapter on Linear Inequalities helps you understand how to compare two values using mathematical symbols. It also shows how to represent these inequalities on a number line or graph, making concepts clearer and more visual. These Class 11 Maths chapter 5 Linear Inequalities question answers help us learn these concepts step by step. Here are some more points on why these question answers are important.
- These solutions build a strong base in understanding and solving inequalities in one variable.
- Students learn how to represent inequalities graphically, which improves their problem-solving skills.
- These concepts are useful in real-life problems like profit-loss, budgeting, and limits.
- Practising Class 11 Maths chapter 5 Linear Inequalities question answers helps us in higher classes and competitive exams where inequalities are common.
NCERT Solutions for Class 11 Maths: Chapter Wise
Given below is the chapter-wise list of the NCERT Class 11 Maths solutions with their respective links:
Also, read,
- NCERT Exemplar Class 11 Maths Solutions Chapter 6 Linear Inequalities
- NCERT notes Class 11 Maths Chapter 6 Linear Inequalities
NCERT Books and NCERT Syllabus
Here are some useful links for NCERT books and the NCERT syllabus for class 11:
- NCERT Books Class 11 Maths
- NCERT Syllabus Class 11 Maths
- NCERT Books Class 11
- NCERT Syllabus Class 11
NCERT Solutions For Class 11- Subject Wise
Here are the subject-wise links for the NCERT solutions of class 11:
Frequently Asked Questions (FAQs)
First of all, read the given problem and try to set an inequality based on the given data. Now solve the inequality using simplifications and algebraic operations, and get the required solution.
Linear Inequalities are used in many real-life applications, some of which are:
- In Business and Finances, where budgets, profits, and loan limits are calculated.
- In engineering, Linear Inequalities are used to determine material strength and the measure of safety.
- Linear Inequalities are also used in health and nutrition to make proper diet controls.
- In traffic management, Linear Inequalities play an important role in setting up maximum speed limits.
- In Education, Linear Inequalities are used to determine admission cutoffs and grades.
Linear inequalities in one variable problems can be easily solved by using the following method:
First of all, you have to isolate the variable using simple mathematical operations like addition, subtraction, multiplication, or division.
Then, if you are multiplying or dividing by a negative number, change the inequality sign accordingly.
At last, you have to represent the solution on a number line or in interval notation.
Linear Equations use the equal sign "=" and have a single solution (or infinitely many in special cases).
Linear Inequalities use the greater than or less than signs like "<, >, ≤, ≥" and have a range of solutions.
Yes, linear inequalities can have multiple solutions. Unlike linear equations, inequalities usually have infinitely many solutions, represented as a range on a number line or an interval.
The feasible region is the area on a graph that satisfies all the given inequalities in a system of inequalities.
A linear inequality is an expression that shows the relationship between two values using symbols like <, >, ≤, or ≥, instead of the equality sign (=).
Strict inequality (< or >) → dashed line.
Non-strict inequality (≤ or ≥) → solid line.
Many educational platforms, such as Careers360, offer free downloadable PDFs of Class 11 Linear Inequalities Chapter 5 Solutions. Students can download the PDF for free from this article itself.

Popular Questions
A block of mass 0.50 kg is moving with a speed of 2.00 ms-1 on a smooth surface. It strikes another mass of 1.00 kg and then they move together as a single body. The energy loss during the collision is
| Option 1)
|
Option 2)
|
| Option 3)
|
Option 4)
|
An athlete in the olympic games covers a distance of 100 m in 10 s. His kinetic energy can be estimated to be in the range
| Option 1)
|
Option 2)
|
| Option 3)
|
Option 4)
|
A particle is projected at 600 to the horizontal with a kinetic energy . The kinetic energy at the highest point
| Option 1)
|
Option 2)
|
| Option 3)
|
Option 4)
|
In the reaction,
| Option 1)
|
Option 2)
|
| Option 3)
|
Option 4)
|
How many moles of magnesium phosphate, will contain 0.25 mole of oxygen atoms?
| Option 1)
0.02 |
Option 2)
3.125 × 10⁻² |
| Option 3)
1.25 × 10⁻² |
Option 4)
2.5 × 10⁻² |