Emversity Allied Health Programs
Get Job Ready in Healthcare | Employability-Focused Programs


NCERT Solutions for Class 10 Maths exercise 14.4 - Cumulative frequency is calculated by adding all frequencies up to a certain threshold. We calculate the cumulative frequency by adding each and every frequency from the frequency distribution table given to us to the sum of its predecessor.
This Story also Contains
In NCERT solutions for Class 10 Maths chapter 14 exercise 14.4 we are introduced to ‘ogives’. An 'ogive of the less than type' is a graph of a cumulative frequency distribution of the less than type. An ‘ogive of the more than type' is a graph depicting a cumulative frequency distribution of the more than type. The median of the grouped frequency distribution is determined by the point of intersection of the ogives of more than and less than types.
The formula for finding the median:

Where,
l = lower limit of median class,
n = number of observations,
cf = cumulative frequency of class preceding the median class,
f = frequency of median class,
h = class size (assuming class size to be equal).
Along with NCERT book Class 10 Maths chapter 14 exercise 14.4, the following exercises are also present.
Q1 The following distribution gives the daily income of 50 workers of a factory.
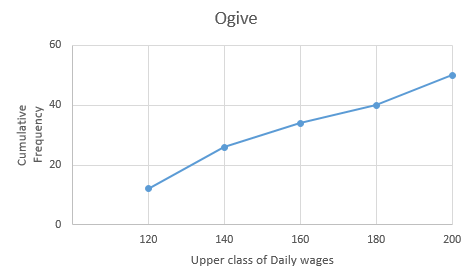
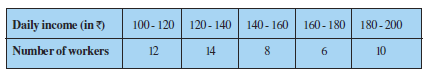 Convert the distribution above to a less than type cumulative frequency distribution, and draw its ogive.
Daily Income (Upper-Class Limit) | Cumulative Frequency |
Less than 120 | 12 |
Less than 140 | 26 |
Less than 160 | 34 |
Less than 180 | 40 |
Less than 200 | 50 |
Now,
Taking upper-class interval on the x-axis and their respective frequencies on the y-axis,
Q2 During the medical check-up of 35 students of a class, their weights were recorded as follows:
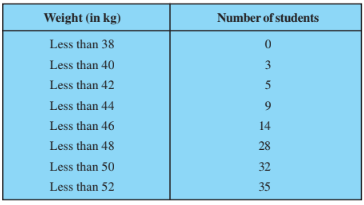 Draw a less than type ogive for the given data. Hence obtain the median weight from the graph and verify the result by using the formula.
Taking upper-class interval on the x-axis and their respective frequencies on the y-axis,
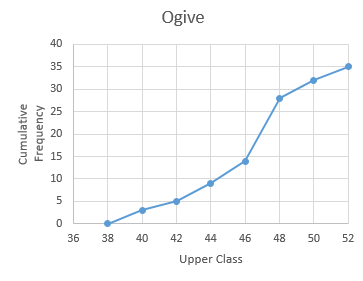
$N= 35 \implies \frac{N}{2} = 17.5$
Marking a point on the curve whose ordinate is 17.5 gives an x-ordinate= 46.5.
Hence, the Median of the data is 46.5
Now,
Weight (Class) | Frequency | Cumulative Frequency |
>38 | 0 | 0 |
38-40 | 3 | 3 |
40-42 | 2 | 5 |
42-44 | 4 | 9 |
44-46 | 5 | 14 |
46-48 | 14 | 28 |
48-50 | 4 | 32 |
50-52 | 3 | 35 |
$N= 35 \implies \frac{N}{2} = 17.5$
$\therefore$ Median class = 46-48; Lower limit, l = 46;
Cumulative frequency of preceding class, c.f. = 14; f = 14; h = 2
$Median = l + \left (\frac{\frac{n}{2}-c.f}{f} \right ).W$
$\\ = 46+ \left (\frac{17.5-14}{14} \right ).2 \\ \\ = 46+\frac{7}{14}$
$= 46.5$
Thus, the median using formula is 46.5 which verifies the result.
Q3 The following table gives production yield per hectare of wheat of 100 farms of a village.
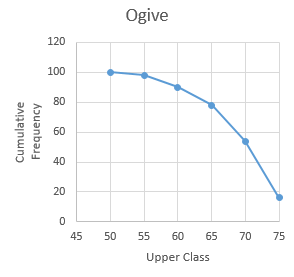
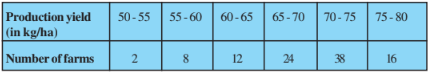 Change the distribution to a more than type distribution, and draw its ogive.
Production yield (Upper-Class Limit) | Cumulative Frequency |
More than or equal to 50 | 100 |
More than or equal to 55 | 98 |
More than or equal to 60 | 90 |
More than or equal to 65 | 78 |
More than or equal to 70 | 54 |
More than or equal to 75 | 16 |
Now,
Taking lower class limit on the x-axis and their respective frequencies on the y-axis,
The modal class is the class with the highest frequency in grouped data. The following formula can be used to determine the mode. When the modal class is unique, the formula is valid for equal class intervals.
The formula for finding the mode:

Where,
l = lower limit of modal class
h = class width
f1 = frequency of the modal class
f0 = frequency of the class preceding the modal class
f2 = frequency of the class succeeding the modal class![]()
Also Read| Statistics Class 10 Notes
Get your results instantly with our calculator!
Exercise 14.4 Class 10 Maths, gives us a concept on STATISTICS and its uses to a board-level of graphs like ogives.
NCERT syllabus Class 10 Maths chapter 14 exercise 14.4 teaches us about the new formula of mode and median.
The concepts from Class 10 Maths chapter 14 exercise 14.4 will give us a vivid image of the graphical representation of Cumulative Frequency Distribution, which is very effective if ogives are given to us in any question.
Also, See:

On Question asked by student community
Hello Dear Student,
You can get directly find, check, get more information here:
Hope it helps!
Hello Student,
If you are asking how to download the migration certificate for Class 10 Karnataka Board, here is how to do it -
You will have to log in to the DigiLocker app or website using your Aadhaar card number and the registered mobile number for the OTP.
You
Hello Student,
The CBSE Class 10th board exam supplementary results can be announced in the second week of July. You can visit the official websites for the results. You will have to enter your roll number, school number, and the admit card ID.
I am also sharing a link of
Hi!
Given below are the links to access the CBSE Class 10th exam pattern:
https://school.careers360.com/exams/cbse-class-10th
https://school.careers360.com/boards/cbse/cbse-10th-exam-pattern
Stay updated.
Hello Ananya,
Please specify the class for which you need the question papers. I am providing Class 10 and 12 papers.
Here are the links to the CBSE Half-yearly Question Papers (2025-2026).
A block of mass 0.50 kg is moving with a speed of 2.00 ms-1 on a smooth surface. It strikes another mass of 1.00 kg and then they move together as a single body. The energy loss during the collision is
| Option 1)
|
Option 2)
|
| Option 3)
|
Option 4)
|
An athlete in the olympic games covers a distance of 100 m in 10 s. His kinetic energy can be estimated to be in the range
| Option 1)
|
Option 2)
|
| Option 3)
|
Option 4)
|
A particle is projected at 600 to the horizontal with a kinetic energy . The kinetic energy at the highest point
| Option 1)
|
Option 2)
|
| Option 3)
|
Option 4)
|
In the reaction,
| Option 1)
|
Option 2)
|
| Option 3)
|
Option 4)
|
How many moles of magnesium phosphate, will contain 0.25 mole of oxygen atoms?
| Option 1)
0.02 |
Option 2)
3.125 × 10⁻² |
| Option 3)
1.25 × 10⁻² |
Option 4)
2.5 × 10⁻² |
Register for iACST. Get instant Scholarship on NEET Repeater Courses.
Study at a world-renowned UK university in India | Admissions open for UG & PG programs.
Apply for UG & PG programmes from Victoria University, Delhi NCR Campus
Admissions open for UG & PG programs at Illinois Tech Mumbai
Apply for UG & PG courses at University of Aberdeen, Mumbai Campus
UG & PG Admissions open for CS/AI/Business/Economics & other programmes.