Search Colleges, Exams, Schools & more


Login
NCERT Solutions for Exercise 14.2 Class 9 Maths Chapter 14 - Statistics
NCERT Solutions for exercise 14.2 Class 9 Maths chapter 14 statistics is another important portion exercise of NCERT solutions for Class 9 Mathematics. As from prior exercise, we know that statistics is nothing a data analysis an area of Mathematics that comes with collecting and presenting amounts of numerical data over one or more places. Talking about exercise 14.2 Class 9 Maths is an exercise followed by exercise 14.1 of the chapter given that consists of introductory numerical problems of collection of data. In this exercise 14.2, we will be studying all those concepts which we talk about in the previous exercise one by one. In chapter 14 of Class 9 NCERT Mathematics, the primary concept of arrangements of students and numerical data will be discussed using examples mentioned with problems.
This Story also Contains
- Statistics Class 9 Maths Chapter 14 Exercise: 14.2
- More About NCERT Solutions for Class 9 Maths Chapter 14 Exercise 14.2
- NCERT Solutions of Class 10 Subject Wise
The Class 9 Maths chapter 14 exercise 14.2 lists basic level numerical problems to learn the concepts of statistics mentioned as terms like frequency mean etc. The class 9th Maths Chapter 14 exercise 14.2 covers Initial topics with examples mentioned and numerical to be solved. Many real-life scenario questions will also be discussed in NCERT solutions for NCERT book Class 9 Maths chapter 14 exercise 14.2. Along with NCERT syllabus Class 9 Maths Chapter 1 exercise 14.2 the following exercises are also present.
Statistics Class 9 Maths Chapter 14 Exercise: 14.2
Q1 The blood groups of 30 students of Class VIII are recorded as follows:
A, B, O, O, AB, O, A, O, B, A, O, B, A, O, O,
A, AB, O, A, A, O, O, AB, B, A, O, B, A, B, O.
Represent this data in the form of a frequency distribution table. Which is the most common, and which is the rarest, blood group among these students?
Answer:
The representation of the given data in the form of a frequency distribution table is as follows.
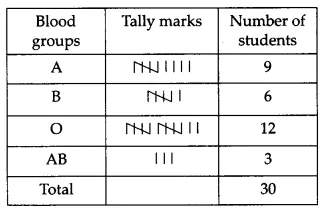
From the table we can see that O is the most common and AB is the rarest blood group.
5 3 10 20 25 11 13 7 12 31
19 10 12 17 18 11 32 17 16 2
7 9 7 8 3 5 12 15 18 3
12 14 2 9 6 15 15 7 6 12
Construct a grouped frequency distribution table with class size $5$ for the data given above taking the first interval as $0-5$ ( $5$ not included). What main features do you observe from this tabular representation?
Answer:
As the minimum and maximum distances of an engineer from his place of work is 2 and 32 respectively the class intervals with class size 5 would be the following.
0 - 5, 5 - 10, 10 - 15, 15 - 20, 20 - 25, 25 - 30, 30 - 35
The representation of the given data in the form of a grouped frequency distribution table is as follows
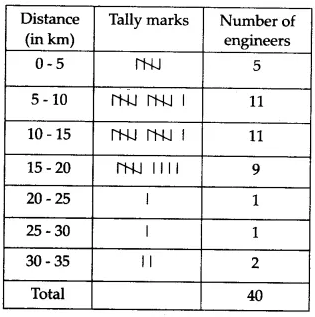
Frequencies of the class intervals 5 - 10 and 10 - 15 are maximum and equal to 11 each and frequencies of the class intervals 20 - 25 and 125 - 30 are minimum and equal to 1 each.
Q3 (i) The relative humidity (in $^{o}/_{o}$ ) of a certain city for a month of $30$ days was as follows:
98.1 98.6 99.2 90.3 86.5 95.3 92.9 96.3 94.2 95.1
89.2 92.3 97.1 93.5 92.7 95.1 97.2 93.3 95.2 97.3
96.2 92.1 84.9 90.2 95.7 98.3 97.3 96.1 92.1 89
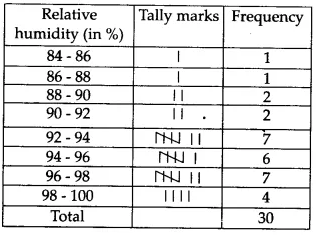
Construct a grouped frequency distribution table with classes 84 - 86, 86 - 88, etc.
Answer:
Q3 (ii) The relative humidity (in $^{o}/_{o}$ ) of a certain city for a month of $30$ days was as follows:
98.1 98.6 99.2 90.3 86.5 95.3 92.9 96.3 94.2 95.1
89.2 92.3 97.1 93.5 92.7 95.1 97.2 93.3 95.2 97.3
96.2 92.1 84.9 90.2 95.7 98.3 97.3 96.1 92.1 89
Which month or season do you think this data is about?
Answer:
As from the table we can see relative humidity in most of the days is above 92% we can conclude the data is from a month of the rainy season. The leaast humidity recorded is 84.9% which also is prettry high.
Q3 (iii) The relative humidity (in $^{o}/_{o}$ ) of a certain city for a month of $30$ days was as follows:
98.1 98.6 99.2 90.3 86.5 95.3 92.9 96.3 94.2 95.1
89.2 92.3 97.1 93.5 92.7 95.1 97.2 93.3 95.2 97.3
96.2 92.1 84.9 90.2 95.7 98.3 97.3 96.1 92.1 89
What is the range of this data?
Answer:
Range of a given data = Highest observation - Lowest Observation
Highest recorded humidity = 99.2%
Lowest recorded humidity = 84.9%
Therefore range of the given data = 99.2 - 84.9 = 14.3%
Q4 (i) The heights of 50 students, measured to the nearest centimetres, have been found to be as follows:
161 150 154 165 168 161 154 162 150 151
162 164 171 165 158 154 156 172 160 170
153 159 161 170 162 165 166 168 165 164
154 152 153 156 158 162 160 161 173 166
161 159 162 167 168 159 158 153 154 159
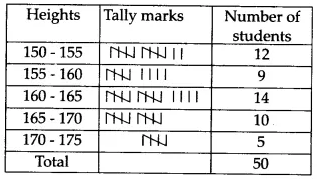
Represent the data given above by a grouped frequency distribution table, taking the class intervals as 160 - 165, 165 - 170, etc.
Answer:
The highest recorded height of a student is 173 cm.
The lowest recorded height of a student is 150 cm.
The class intervals would therefore be 150 -155, 155 - 160, 160 - 165, 165 - 170, 170 - 175
The representation of the given data in the form of a grouped frequency distribution table is as follows.
Q4 (ii) The heights of 50 students, measured to the nearest centimetres, have been found to be as follows:
161 150 154 165 168 161 154 162 150 151
162 164 171 165 158 154 156 172 160 170
153 159 161 170 162 165 166 168 165 164
154 152 153 156 158 162 160 161 173 166
161 159 162 167 168 159 158 153 154 159
What can you conclude about their heights from the table?
Answer:
From the table we can conclude that maximum students have height in the range 160 - 165 cm and more than half of the students are shorter than 165 cm.
0.03 0.08 0.08 0.09 0.04 0.17
0.16 0.05 0.02 0.06 0.18 0.20
0.11 0.08 0.12 0.13 0.22 0.07
0.08 0.01 0.10 0.06 0.09 0.18
0.11 0.07 0.05 0.07 0.01 0.04
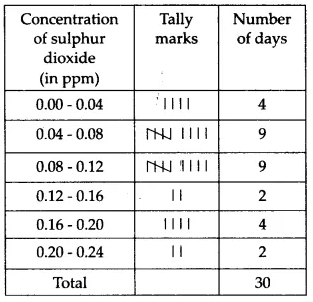
Make a grouped frequency distribution table for this data with class intervals as 0.00 - 0.04, 0.04 - 0.08, and so on.
Answer:
The lowest value of the concentration of sulphur dioxide in the air is 0.01 ppm
The highest value of the concentration of sulphur dioxide in the air is 0.22 ppm
The representation of the given data in the form of a frequency distribution table is as follows.
0.03 0.08 0.08 0.09 0.04 0.17
0.16 0.05 0.02 0.06 0.18 0.20
0.11 0.08 0.12 0.13 0.22 0.07
0.08 0.01 0.10 0.06 0.09 0.18
0.11 0.07 0.05 0.07 0.01 0.04
For how many days, was the concentration of sulphur dioxide more than 0.11 parts per million?
Answer:
From the frequency distribution table, we can see the concentration of sulphur dioxide was more than 0.11 ppm for 8 days.
It was in the range 0.12 - 0.16 for 2 days, 0.16 - 0.20 for 4 days and 0.20 - 0.24 for 2 days.
0 1 2 2 1 2 3 1 3 0
1 3 1 1 2 2 0 1 2 1
3 0 0 1 1 2 3 2 2 0
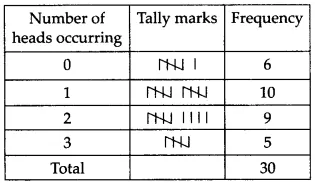
Prepare a frequency distribution table for the data given above
Answer:
A frequency distribution table for the data given above is as follows.
Q7 (i) The value of $\pi$ upto $\50$ decimal places is given below:
3.14159265358979323846264338327950288419716939937510
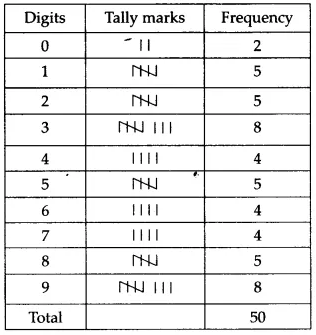
Make a frequency distribution of the digits from 0 to 9 after the decimal point.
Answer:
The representation of the given data in the form of a frequency distribution table is as follows.
Q7 (ii) The value of $\pi$ up to $\50$ decimal places is given below:
3.14159265358979323846264338327950288419716939937510
What are the most and the least frequently occurring digits?
Answer:
The most frequently occurring digits are 3 and 9 with a frequency of 8.
1 6 2 3 5 12 5 8 4 8
10 3 4 12 2 8 15 1 17 6
3 2 8 5 9 6 8 7 14 12
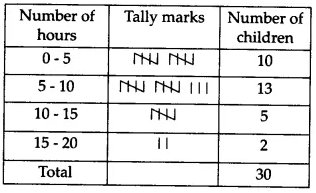
Make a grouped frequency distribution table for this data, taking class width 5 and one of the class intervals as 5 - 10.
Answer:
The highest number of hours for which a child watched TV = 17
The lowest number of hours for which a child watched TV = 1
The class intervals with class width 5 would, therefore, be 1 - 5, 5 - 10, 10 - 15, 15 - 20
The representation of the given data in the form of a frequency distribution table is as follows.
1 6 2 3 5 12 5 8 4 8
10 3 4 12 2 8 15 1 17 6
3 2 8 5 9 6 8 7 14 12
How many children watched television for 15 or more hours a week?
Answer:
2 children watched television for 15 or more hours a week as we can see from the frequency distribution table. Frequency of the class interval 15 - 20 is 2.
2.6 3.0 3.7 3.2 2.2 4.1 3.5 4.5
3.5 2.3 3.2 3.4 3.8 3.2 4.6 3.7
2.5 4.4 3.4 3.3 2.9 3.0 4.3 2.8
3.5 3.2 3.9 3.2 3.2 3.1 3.7 3.4
4.6 3.8 3.2 2.6 3.5 4.2 2.9 3.6
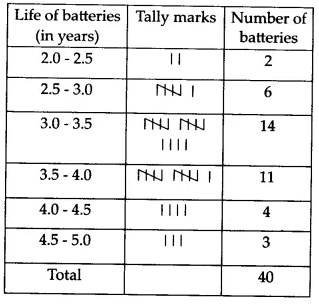
Construct a grouped frequency distribution table for this data, using class intervals of size 0.5 starting from the interval 2 - 2.5.
Answer:
The least value of life of a battery recorded = 2.2
The highest value of life of a battery recorded = 4.6
The class intervals with interval size 0.5 would therefore be 2.0 - 2.5, 2.5 - 3.0, 3.0 - 3.5, 3.5 - 4.0, 4.0 - 4.5, 4.5 - 5.0
The representation of the given data in the form of a frequency distribution table is as follows.
More About NCERT Solutions for Class 9 Maths Chapter 14 Exercise 14.2
There are only 8-9 questions that cover the theory as well as practical aspects of exercise and chapter too as mentioned in exercise 14.2 Class 9 Maths. The initial questions give a basic idea of data analysis and working that can be collected from daily life. As the number increases the level of questions also increases in NCERT solutions for Cass 9 Maths chapter 14 exercise 14.2. In last of Class 9 Maths chapter 14 exercise 14.2 gives the briefing of all the introductory topics and examples discussed over chapter. The Class 9 Maths chapter 14 exercise 14.2 is to simplify mathematical terms for students to work on their problem-solving skills.
Also Read| Statistics Class 9 Notes
Benefits of NCERT Solutions for Class 9 Maths Chapter 14 Exercise 14.2
The solved example given in exercise 14.2 Class 9 Maths and the NCERT solutions for Class 9 Maths chapter 14 exercise 14.2 are important as it covers questions from the frequency of random and distributed data and questions related to grouping and ungrouping of data.
If students can solve each and over the most question of this exercise 14.2 Class 9 Maths they will be able to enjoy statistics initial to another level that is given in Class 9 Maths chapter 14 exercise 14.2
One last benefit of solving Class 9 Maths chapter 1 exercise 14.2 is students understand the formulas methods by heart instead of just Cramming with no prior knowledge and practice.
Also, see-
Confused between CGPA and Percentage?
Get your results instantly with our calculator!
💡 Conversion Formula used is: Percentage = CGPA × 9.5
NCERT Solutions of Class 10 Subject Wise
Articles
Upcoming School Exams

Popular Questions
A block of mass 0.50 kg is moving with a speed of 2.00 ms-1 on a smooth surface. It strikes another mass of 1.00 kg and then they move together as a single body. The energy loss during the collision is
| Option 1)
|
Option 2)
|
| Option 3)
|
Option 4)
|
An athlete in the olympic games covers a distance of 100 m in 10 s. His kinetic energy can be estimated to be in the range
| Option 1)
|
Option 2)
|
| Option 3)
|
Option 4)
|
A particle is projected at 600 to the horizontal with a kinetic energy . The kinetic energy at the highest point
| Option 1)
|
Option 2)
|
| Option 3)
|
Option 4)
|
In the reaction,
| Option 1)
|
Option 2)
|
| Option 3)
|
Option 4)
|
How many moles of magnesium phosphate, will contain 0.25 mole of oxygen atoms?
| Option 1)
0.02 |
Option 2)
3.125 × 10⁻² |
| Option 3)
1.25 × 10⁻² |
Option 4)
2.5 × 10⁻² |
Colleges After 12th
Applications for Admissions are open.
Study at a world-renowned UK university in India | Admissions open for UG & PG programs.
Victoria University, Delhi NCR
ApplyApply for UG & PG programmes from Victoria University, Delhi NCR Campus
Illinois Tech Mumbai
ApplyAdmissions open for UG & PG programs at Illinois Tech Mumbai
University of Aberdeen Mumbai
ApplyApply for UG & PG courses at University of Aberdeen, Mumbai Campus
University of York, Mumbai
ApplyUG & PG Admissions open for CS/AI/Business/Economics & other programmes.
University of Bristol, Mumbai Enterprise Campus
ApplyBristol's expertise meets Mumbai's innovation. Admissions open for UG & PG programmes