NCERT solutions for Class 9 Science are step by step answers to all the questions given in the NCERT science textbook. They are designed to help students understand concepts clearly.
Search Colleges, Exams, Schools & more


Login
NCERT Solutions for Class 9 Science Chapter 4 - Describing Motion Around Us
Describing Motion Around Us Class 9 NCERT solutions are made to give clear, step-by-step answers for every question in Class 9 Science(Exploration) Chapter 4. These Class 9 Describing Motion Around Us NCERT solutions cover the important topics like motion in daily life, velocity, Displacement, acceleration, and uniform circular motion, etc. These solutions are based on the latest NCERT textbook.
This Story also Contains
- Class 9 Science(Exploration) Chapter 4 - Describing Motion Around Us Question Answers: Download Solution PDF
- Class 9 Science Chapter 4 - Describing Motion Around Us Revise, Reflect, Refine Question Answer:
- Class 9 Science Chapter 4 - Describing Motion Around Us Pause and Ponder Question Answer:
- Class 9 Science Chapter 4 - Describing Motion Around Us Activity Question Answer:
- NCERT Solution for Class 9 Science Chapter 4: Topics
The Describing Motion Around Us Class 9 questions answers also include all the Revise, Reflect, Refine as well as the in-text questions, so students can understand both the numerical parts and the theory-based ones in a smoother way. Students may download the Class 9 Science Chapter 4 Revise, Reflect, Refine question answer PDF for free. Each Class 9 Science Chapter 4 question answer set is prepared by subject experts and is aligned with the latest CBSE Science syllabus.
Class 9 Science(Exploration) Chapter 4 - Describing Motion Around Us Question Answers: Download Solution PDF
Class 9 Science Chapter 4 Describing Motion Around Us Question Answers PDF made for students, so they can understand the lesson in a clear and simple way. In this NCERT Solution for class 9 science, you get well-explained answers for every NCERT question. This PDF can be used for daily practice plus quick revision, especially before exams. It is really a helpful kind of resource, to boost your understanding and get better marks in the tests.
Class 9 Science Chapter 4 - Describing Motion Around Us Revise, Reflect, Refine Question Answer:
In this section, you will get the answers to the Revise, Reflect, Refine questions of the chapter, which helps students to check their understanding and improve their concepts. It is also useful for quick revision and self-assessment before exams.
1. My father went to a shop from home which is located at a distance of 250 m on a straight road. On reaching there, he discovered that he forgot to carry a cloth bag. He came home to take it, went to the shop again, bought provisions and came back home. How much was the total distance travelled by him? What was his displacement from home?
Solution:
Distance between home and shop $=250 \mathrm{~m}$
The person goes from home to shop, then back home, again to the shop, and finally returns home.
Total distance travelled:
$=250+250+250+250=1000 \mathrm{~m}$
Displacement: The initial and final positions are the same (home).
$\text { Displacement }=0 \mathrm{~m}$
2. A student runs from the ground floor to the fourth floor of a school building to collect a book and then comes down to their classroom on the second floor. If the height of each floor is 3 m, find:
(i) the total vertical distance travelled, and
(ii) their displacement from the starting point.
Solution:
Height of each floor $=3 \mathrm{~m}$
From ground floor to fourth floor:
$4 \times 3=12 \mathrm{~m}$
From fourth floor to second floor:
$(4-2) \times 3=2 \times 3=6 \mathrm{~m}$
(i) Total vertical distance travelled: $12+6=18 \mathrm{~m}$
(ii) Displacement from starting point:
Initial position = ground floor
Final position $=$ second floor
$2 \times 3=6 \mathrm{~m} \text { (upward) }$
3. A girl is riding her scooter and finds that its speedometer reading is constant. Is it possible for her scooter to be accelerating and if so, how?
Solution: Yes, it is possible for the scooter to be accelerating even if the speedometer reading is constant.
Acceleration depends on the change in velocity, and velocity includes both speed and direction. Even if the speed remains constant, a change in direction will result in acceleration.
For example, when the girl turns the scooter along a curved path or takes a turn, the direction of motion changes. This causes acceleration, even though the speed shown on the speedometer remains the same.
4. A car starts from rest and its velocity reaches 24 m/s in 6 s. Find the average acceleration and the distance travelled in these 6 s.
Solution:
Given:
Initial velocity, $u=0$
Final velocity, $v=24 \mathrm{~m} / \mathrm{s}$
Time, $t=6 \mathrm{~s}$
Average acceleration: $a=\frac{v-u}{t}=\frac{24-0}{6}=4 \mathrm{~m} / \mathrm{s}^2$
Distance travelled: $s=\frac{(u+v)}{2} \times t=\frac{(0+24)}{2} \times 6=12 \times 6=72 \mathrm{~m}$
5. A motorbike moving with initial velocity 28 m/s and constant acceleration stops after travelling 98 m. Find the acceleration of the motorbike and the time taken to come to a stop.
Solution:
Given:
Initial velocity $u=28 \mathrm{~m} / \mathrm{s}$
Final velocity $v=0 \mathrm{~m} / \mathrm{s}$
Distance $s=98 \mathrm{~m}$
Using the equation:
$
\begin{gathered}
v^2=u^2+2 a s \\
0=(28)^2+2 a(98) \\
0=784+196 a \\
196 a=-784 \\
a=-4 \mathrm{~m} / \mathrm{s}^2
\end{gathered}
$
$
\begin{gathered}
v=u+a t \\
0=28+(-4) t \\
4 t=28 \\
t=7 \mathrm{~s}
\end{gathered}
$
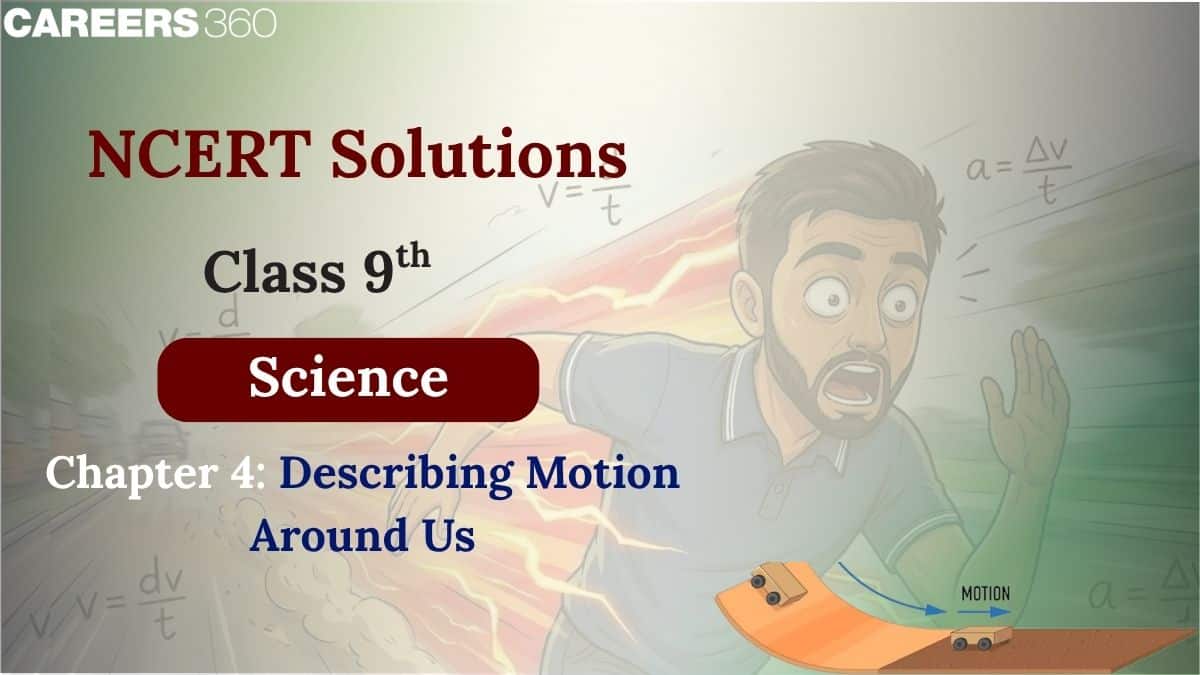
6. Fig. 4.27 shows a position-time graph of two objects A and B that are moving along the parallel tracks in the same direction. Do objects A and B ever have equal velocity? Justify your answer.
![]()
Solution: No, objects A and B never have equal velocity. Both graphs are straight lines, which means both objects are moving with constant velocity. Velocity is given by the slope of the graph. Since the line for object A is steeper than that of object B, object A has a higher velocity. As the slopes remain constant and different, their velocities are always different and never become equal.
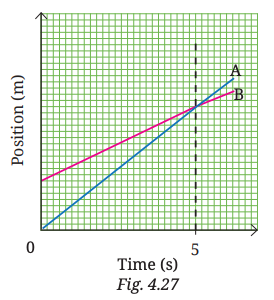
7. A graph in Fig. 4.28 shows the change in position with time for two objects A and B moving in a straight line from 0 to 10 seconds. Choose the correct option(s).
(i) The average velocity of both over the 10 s time interval is equal since they have the same initial and final positions.
(ii) The average speeds of both over the 10 s time interval are equal since both cover equal distance in equal time.
(iii) The average speed of A over the 10 s time interval is lower than that of B since it covers a shorter distance than B in 10 seconds.
(iv) The average speed of A over the 10 s time interval is greater than that of B since B’s speed is lower than A’s in some segments.
![]()
Solution:
(i) Both A and B start and end at the same position after 10 s, so their displacement is the same. Since time is also the same, their average velocity is equal. This statement is TRUE.
(ii) Average speed depends on the total distance travelled, not just start and end points. A covers more distance than B, so their average speeds are not equal. This statement is FALSE.
(iii) A covers more distance than B, so its average speed is actually greater, not lower. This statement is FALSE.
(iv) Since A travels more distance in the same time, its average speed is greater than B. This statement is TRUE.
Correct answers: (i) and (iv)
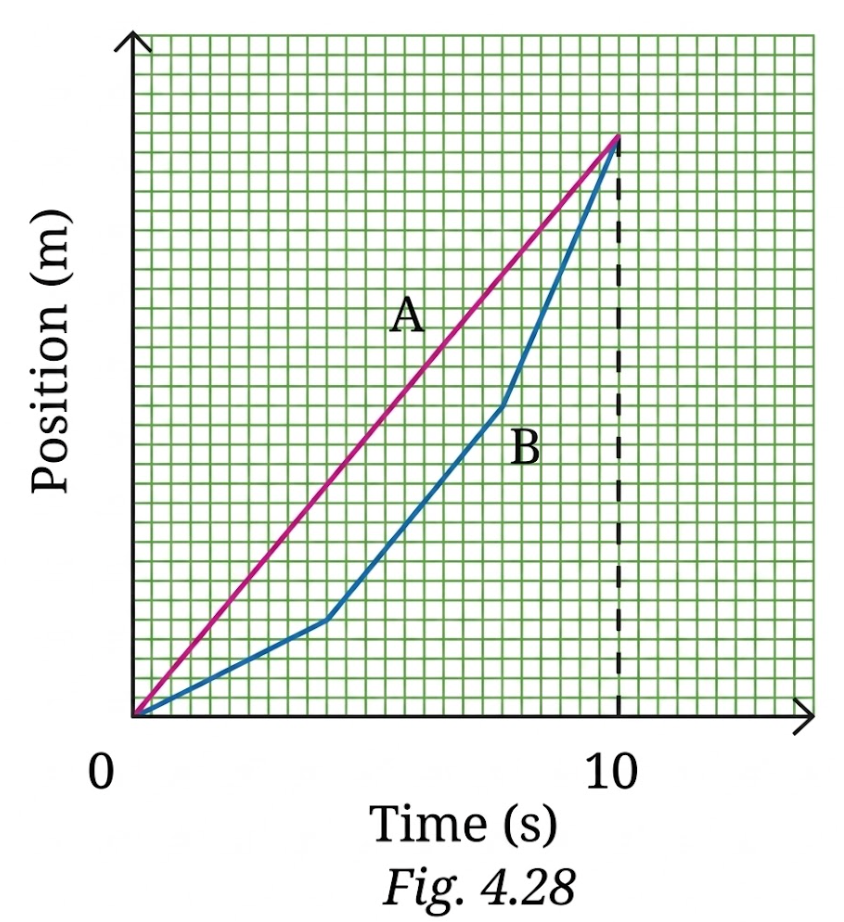
8. A truck driver driving at the speed of 54 km h–1 notices a road sign with a speed limit of 40 km h–1 (Fig. 4.29) for trucks. He slows down to 36 km h–1 in 36 s. What was the distance travelled by him during this
time? Assume the acceleration to be constant while slowing down.
![]()
Solution:
Given:
Initial speed $u=54 \mathrm{~km} / \mathrm{h}=15 \mathrm{~m} / \mathrm{s}$
Final speed $v=36 \mathrm{~km} / \mathrm{h}=10 \mathrm{~m} / \mathrm{s}$
Time $t=36 \mathrm{~s}$
$
\begin{gathered}
s=\frac{(u+v)}{2} \times t \\
s=\frac{(15+10)}{2} \times 36 \\
s=\frac{25}{2} \times 36 \\
s=12.5 \times 36=450 \mathrm{~m}
\end{gathered}
$
9. A car starts from rest and accelerates uniformly to $20 \mathrm{~m} \mathrm{~s}^{-1}$ in 5 seconds. It then travels at $20 \mathrm{~m} \mathrm{~s}^{-1}$ for 10 seconds and finally applies the brake (with uniform acceleration) to stop in 6 seconds. Find the total distance travelled.
Solution:
Given:
Car starts from rest, so $u=0$
Maximum speed $v=20 \mathrm{~m} / \mathrm{s}$
(i) During acceleration (first 5 s ):
$
\begin{gathered}
s_1=\frac{(u+v)}{2} \times t \\
s_1=\frac{(0+20)}{2} \times 5=10 \times 5=50 \mathrm{~m}
\end{gathered}
$
(ii) During uniform motion (next 10 s):
$
s_2=v \times t=20 \times 10=200 \mathrm{~m}
$
(iii) During retardation (last 6 s):
$
\begin{gathered}
s_3=\frac{(u+v)}{2} \times t \\
s_3=\frac{(20+0)}{2} \times 6=10 \times 6=60 \mathrm{~m}
\end{gathered}
$
Total distance travelled:
$
s=s_1+s_2+s_3=50+200+60=310 \mathrm{~m}
$
10. A bus is travelling at $36 \mathrm{~km} \mathrm{~h}^{-1}$ when the driver sees an obstacle 30 m ahead. The driver takes 0.5 seconds to react before pressing the brake. Once the brake is applied, the velocity of the bus reduces with constant acceleration of $2.5 \mathrm{~m} \mathrm{~s}^{-2}$. Will the bus be able to stop before reaching the obstacle?
Solution:
Given:
Initial speed $u=36 \mathrm{~km} / \mathrm{h}=10 \mathrm{~m} / \mathrm{s}$
Distance to obstacle $=30 \mathrm{~m}$
Reaction time $t=0.5 \mathrm{~s}$
Deceleration $a=-2.5 \mathrm{~m} / \mathrm{s}^2$
(i) Distance covered during reaction time:
$
s_1=u \times t=10 \times 0.5=5 \mathrm{~m}
$
(ii) Distance covered after applying brakes:
$
\begin{gathered}
v^2=u^2+2 a s \\
0=(10)^2+2(-2.5) s \\
0=100-5 s \\
5 s=100 \\
s_2=20 \mathrm{~m}
\end{gathered}
$
(iii) Total stopping distance:
$
s=s_1+s_2=5+20=25 \mathrm{~m}
$
Comparison with obstacle distance:
$
25 \mathrm{~m}<30 \mathrm{~m}
$
Yes, the bus will stop before reaching the obstacle, as it stops in 25 m, which is less than 30 m.
11. A student said, “The Earth moves around the Sun”. In this context, discuss whether an object kept on the Earth can be considered to be at rest.
Solution:
An object kept on the Earth can be considered at rest with respect to the Earth, because it does not change its position relative to its surroundings.
However, it is not at rest with respect to the Sun, because the Earth itself is moving around the Sun, and the object moves along with it.
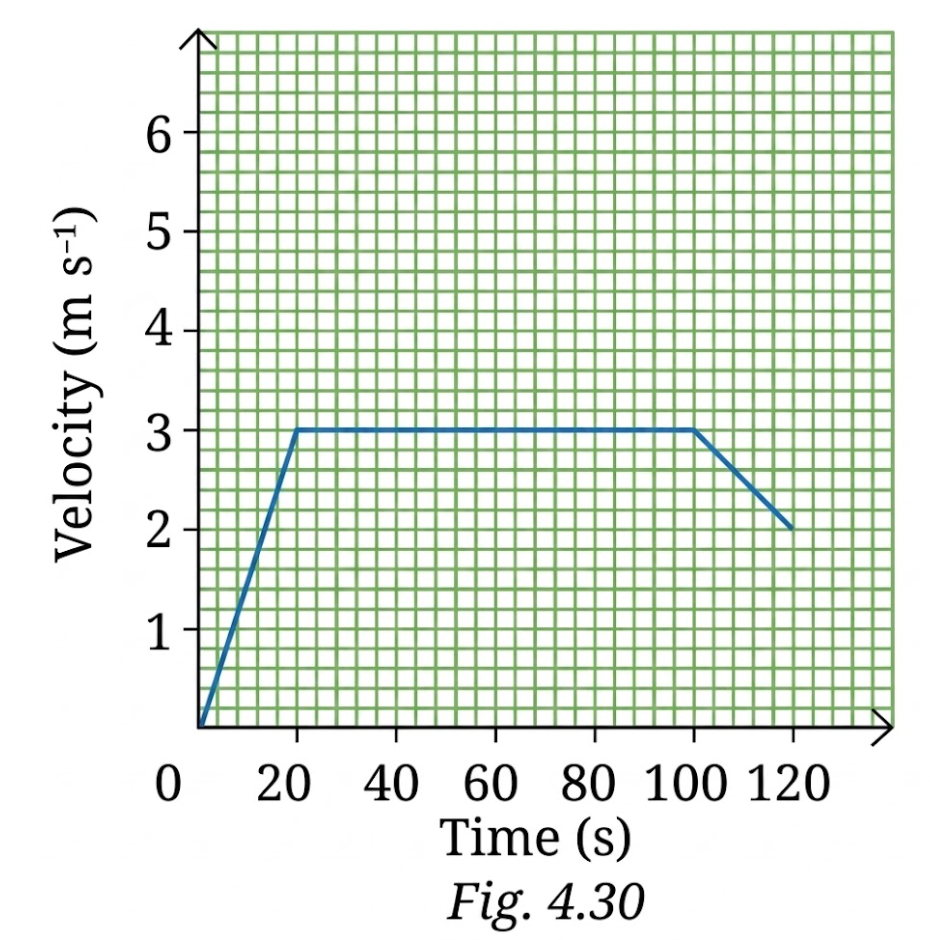
12. The velocity-time graph from 0 s to 120 s for a cyclist is shown in Fig. 4.30. Shade the areas (in different colours) representing the displacement of the cyclist
(i) while cyclist is moving with constant velocity.
(ii) when the velocity of cyclist is decreasing.
Also, calculate the displacement and average acceleration in the 120 s
time interval.
![]()
Solution:
Nature of motion:
(i) Constant velocity: From 20 s to 100 s
(ii) Decreasing velocity: From 100 s to 120 s
Displacement (Area under velocity-time graph)
From 0 to 20 s (triangle):
$
s_1=\frac{1}{2} \times 20 \times 3=30 \mathrm{~m}
$
From 20 to 100 s (rectangle):
$
s_2=80 \times 3=240 \mathrm{~m}
$
From 100 to 120 s (trapezium):
$
s_3=\frac{(3+2)}{2} \times 20=2.5 \times 20=50 \mathrm{~m}
$
Total displacement:
$
s=s_1+s_2+s_3=30+240+50=320 \mathrm{~m}
$
Average acceleration:
$
a=\frac{v-u}{t}=\frac{2-0}{120}=\frac{1}{60} \approx 0.017 \mathrm{~m} / \mathrm{s}^2
$
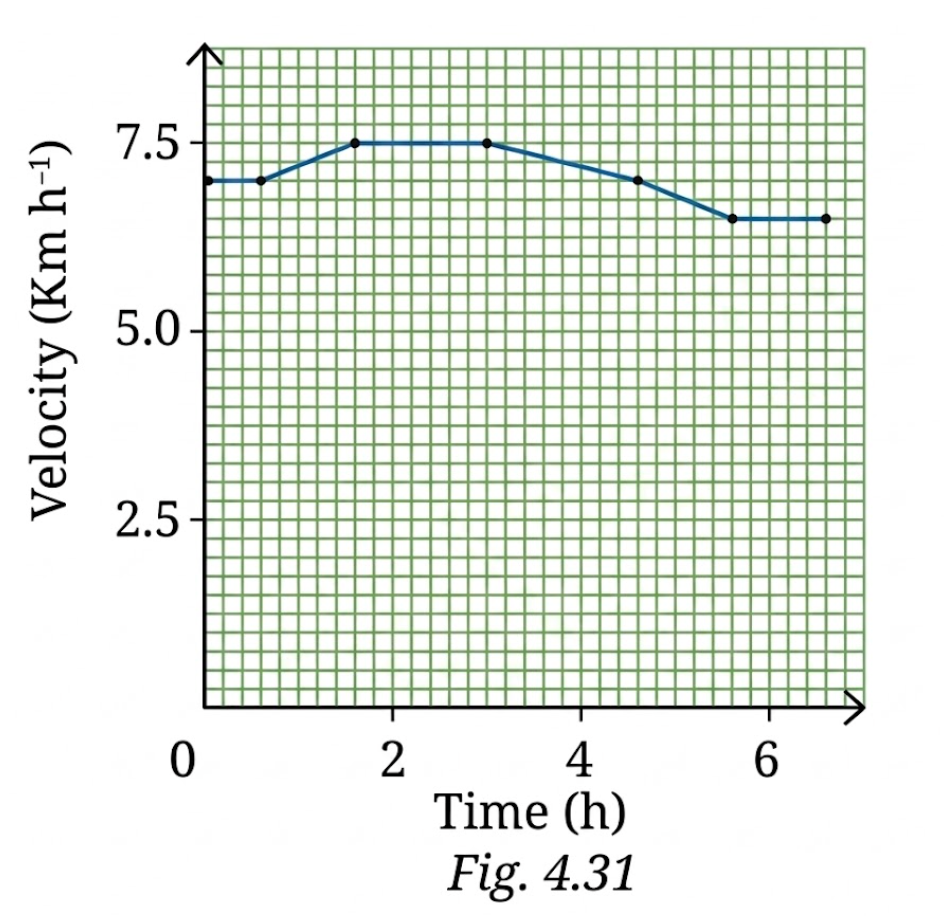
13. A girl is preparing for her first marathon by running on a straight road. She uses a smartwatch to calculate her running speed at different intervals. The graph (Fig. 4.31) depicts her velocity versus time. Estimate the distance she ran based on the graph.
![]()
Solution:
Distance is equal to the area under the velocity-time graph.
From the graph, the velocity is approximately between $6.5 \mathrm{~km} / \mathrm{h}$ and $7.5 \mathrm{~km} / \mathrm{h}$ over a time of 6 hours.
Taking average velocity $\approx 7 \mathrm{~km} / \mathrm{h}$,
$
\begin{aligned}
\text { Distance } & =\text { Average velocity × Time } \\
& =7 \times 6 \\
& =42 \mathrm{~km}
\end{aligned}
$
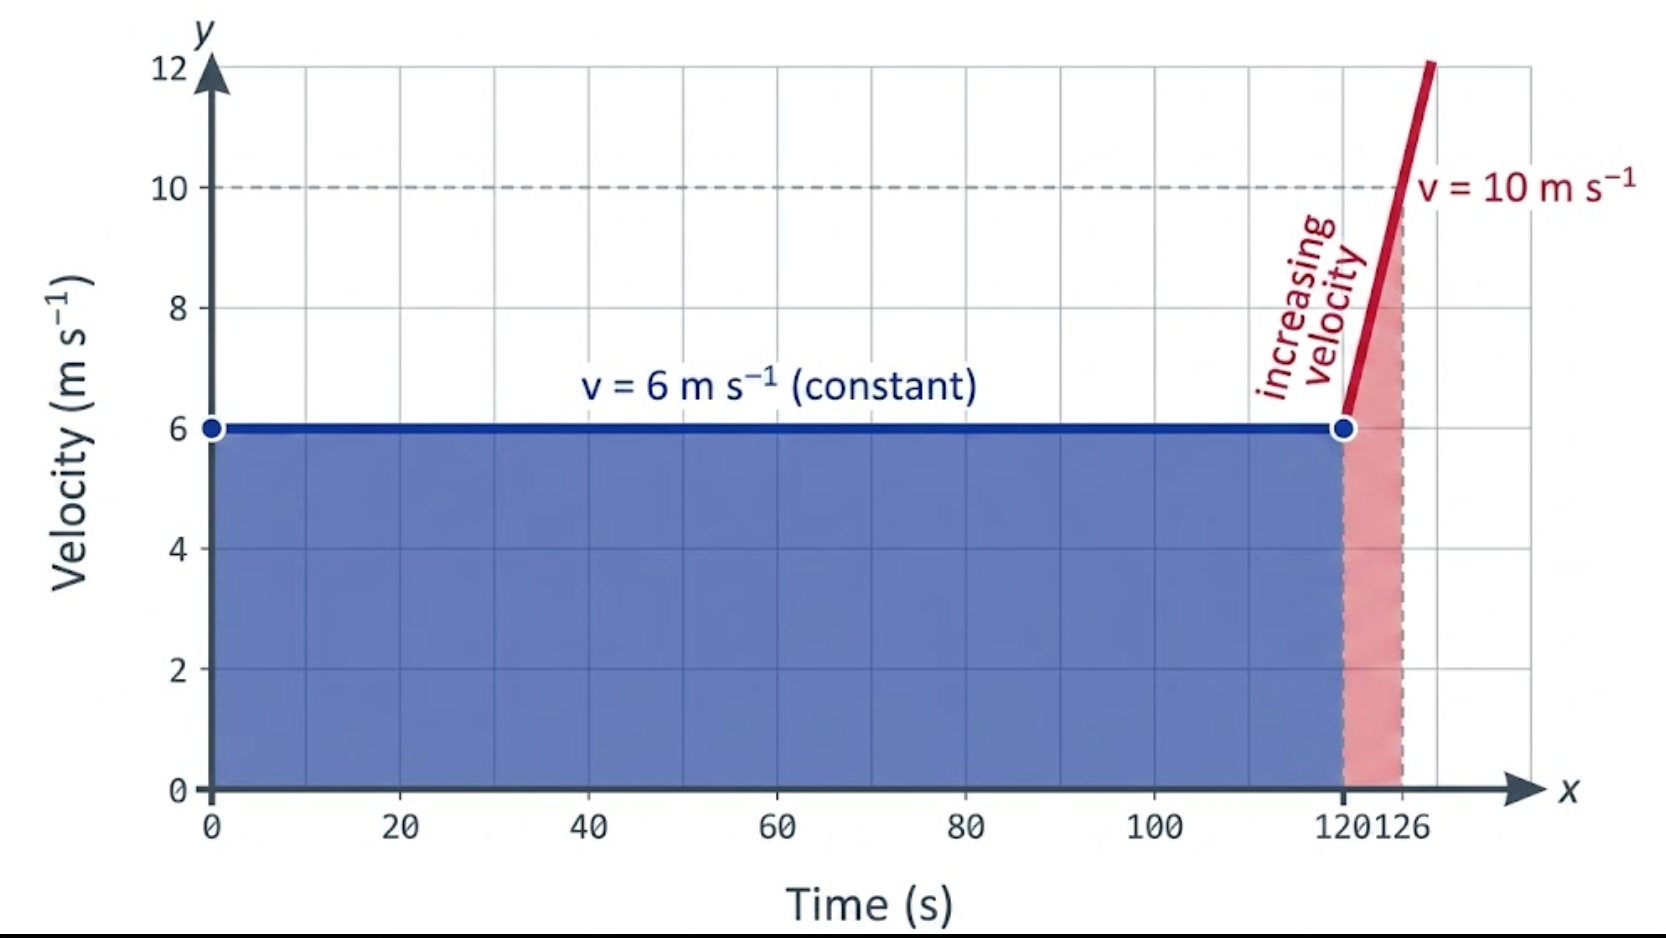
14. On entering a state highway, a car continues to move with a constant velocity of $6 \mathrm{~m} \mathrm{~s}^{-1}$ for 2 minutes and then accelerates with a constant acceleration $1 \mathrm{~m} \mathrm{~s}^{-2}$ for 6 seconds. Find the displacement of the car on the state highway in the $2 \min 6 \mathrm{~s}$ time interval by drawing a velocity-time graph for its motion.
Solution:
Given:
Time $=2 \mathrm{~min}=120 \mathrm{~s}$
Velocity $v=6 \mathrm{~m} / \mathrm{s}$
(i) Distance at constant velocity:
$
s_1=v \times t=6 \times 120=720 \mathrm{~m}
$
(ii) Distance during acceleration (last 6 s ):
Given:
$u=6 \mathrm{~m} / \mathrm{s}, a=1 \mathrm{~m} / \mathrm{s}^2, t=6 \mathrm{~s}$
$
\begin{gathered}
s_2=u t+\frac{1}{2} a t^2 \\
s_2=6 \times 6+\frac{1}{2} \times 1 \times(6)^2 \\
s_2=36+18=54 \mathrm{~m}
\end{gathered}
$
Total displacement:
$
s=s_1+s_2=720+54=774 \mathrm{~m}
$
![]()
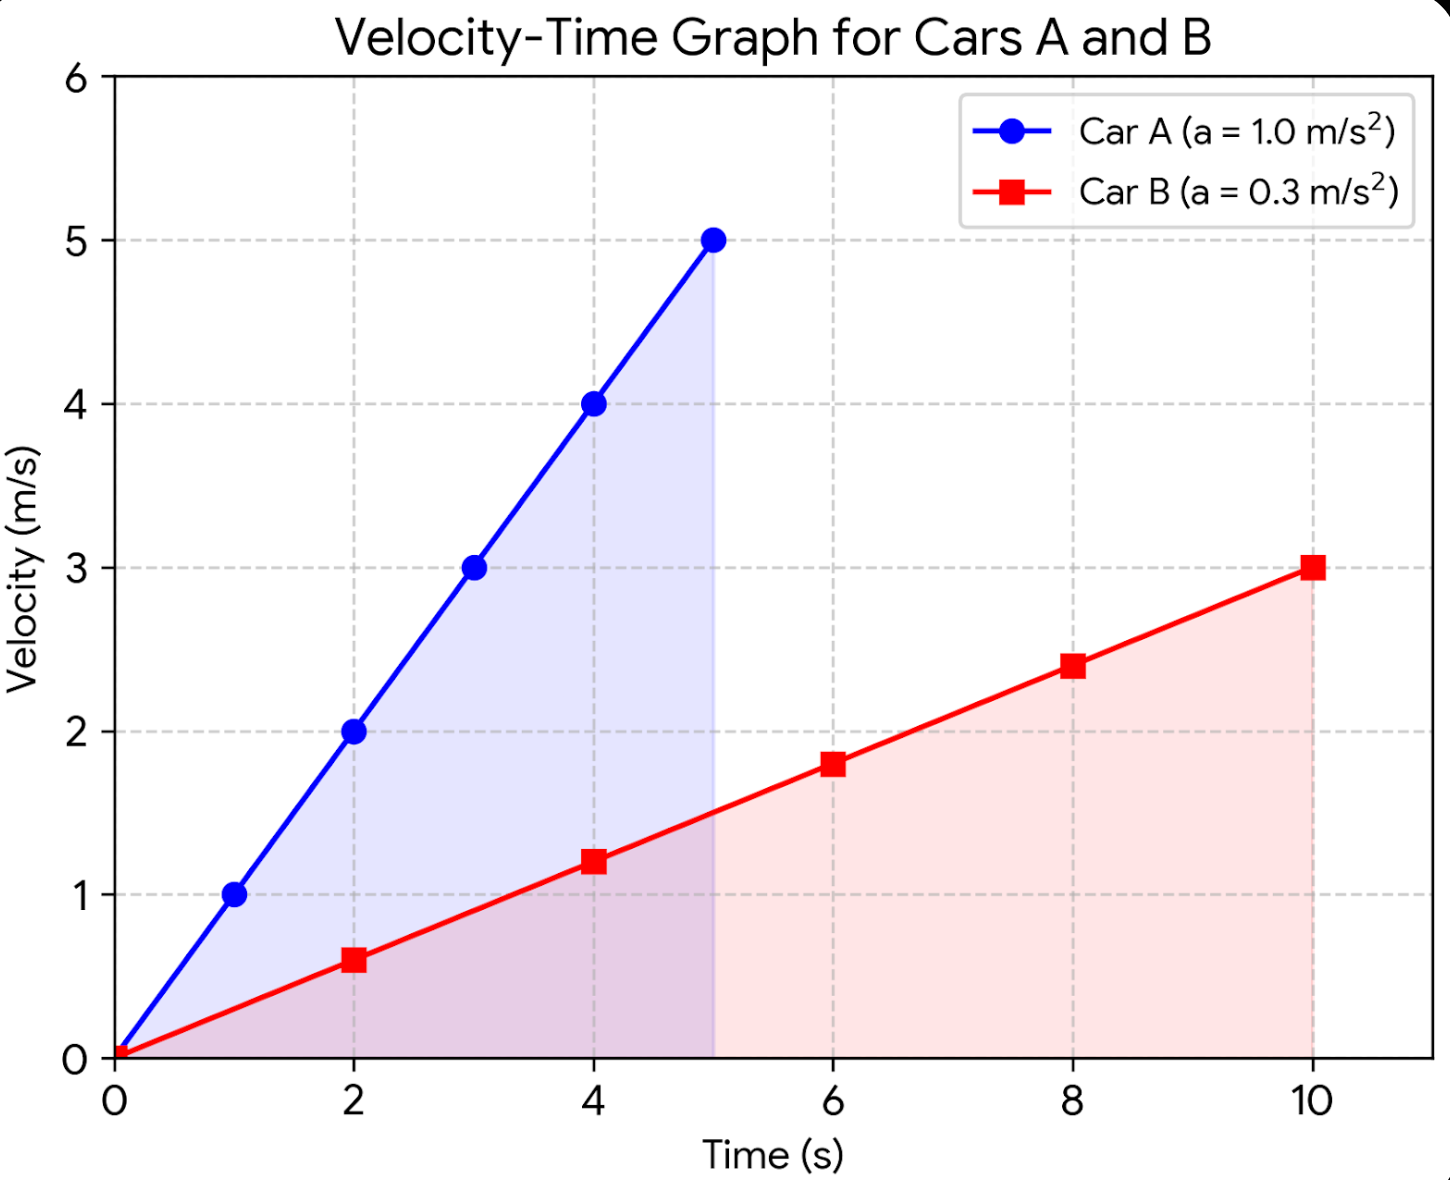
15. Two cars A and B start moving with a constant acceleration from rest, in a straight line. Car A attains a velocity of $5 \mathrm{~m} \mathrm{~s}^{-1}$ in 5 s . Car B attains a velocity of $3 \mathrm{~m} \mathrm{~s}^{-1}$ in 10 s . Plot the velocity-time graphs for both the cars in the same graph. Using the graph, calculate the displacement in the two time intervals mentioned (Hint: Calculate the acceleration in both cases. Then calculate their velocities at five instants of time to plot the graph).
Solution:
For car A:
$
a_A=\frac{v}{t}=\frac{5}{5}=1 \mathrm{~m} / \mathrm{s}^2
$
For car B:
$
a_B=\frac{v}{t}=\frac{3}{10}=0.3 \mathrm{~m} / \mathrm{s}^2
$
Velocity–Time Table for Plotting
Car A (0–5 s):
|
Time (s) |
Velocity (m/s) |
|
0 |
0 |
|
1 |
1 |
|
2 |
2 |
|
3 |
3 |
|
4 |
4 |
|
5 |
5 |
Car B (0–10 s):
|
Time (s) |
Velocity (m/s) |
|
0 |
0 |
|
2 |
0.6 |
|
4 |
1.2 |
|
6 |
1.8 |
|
8 |
2.4 |
|
10 |
3 |
![]()
Displacement (area under graph):
Car A (0-5 s):
$s_A=\frac{1}{2} \times 5 \times 5=12.5 \mathrm{~m}$
Car B (0-10 s):
$s_B=\frac{1}{2} \times 10 \times 3=15 \mathrm{~m}$
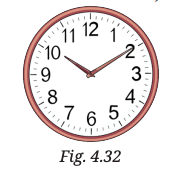
16. Rohan studies science from 6 PM to 7:30 PM at home. Consider the tip of the minute’s hand of the wall clock. During the given time interval, what is its:
(i) distance travelled,
(ii) displacement,
(iii) speed, and
(iv) velocity.
The length of the minute’s hand is 7 cm (Fig. 4.32).
![]()
Solution:
Given:
Time interval $=6: 00 \mathrm{PM}$ to $7: 30 \mathrm{PM}=90 \mathrm{~min}=1.5 \mathrm{~h}=5400 \mathrm{~s}$
Radius $r=7 \mathrm{~cm}$
The minute hand completes 1 revolution in 60 min .
So, in 90 min it completes 1.5 revolutions.
(i) Distance travelled
$
\begin{gathered}
\text { Distance }=1.5 \times 2 \pi r \\
=1.5 \times 2 \pi \times 7=21 \pi \approx 66 \mathrm{~cm}
\end{gathered}
$
(ii) Displacement
After 1.5 revolutions, the tip reaches the diametrically opposite point.
$
\text { Displacement }=2 r=14 \mathrm{~cm}
$
(iii) Speed
$
\text { Speed }=\frac{\text { Distance }}{\text { Time }}=\frac{21 \pi}{5400} \approx 0.0122 \mathrm{~cm} / \mathrm{s}
$
(iv) Velocity
$
\text { Velocity }=\frac{\text { Displacement }}{\text { Time }}=\frac{14}{5400} \approx 0.0026 \mathrm{~cm} / \mathrm{s}
$
Confused between CGPA and Percentage?
Get your results instantly with our calculator!
💡 Conversion Formula used is: CGPA = Percentage / 9.5
Class 9 Science Chapter 4 - Describing Motion Around Us Pause and Ponder Question Answer:
This section includes simple and thoughtful answers to the Pause and Ponder questions, helping students think deeply about the concepts. It supports better understanding and strengthens conceptual clarity.
Pause and Ponder (Page 51)
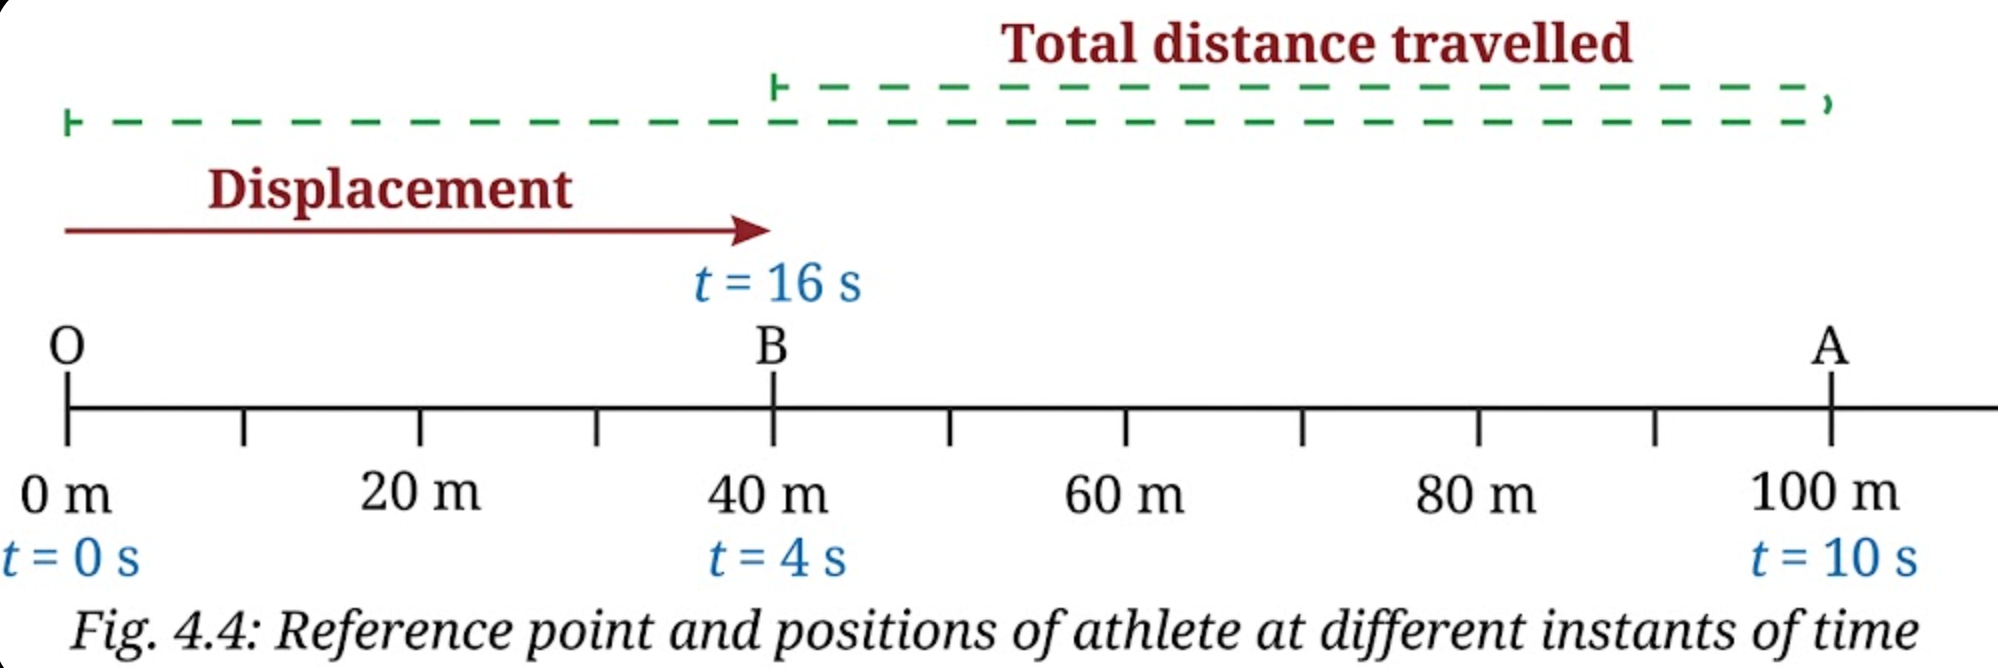
1. In the example of an athlete running back and forth on a straight track (Fig. 4.4), when will the displacement of the athlete be zero? What will be the total distance travelled in that case?

![]()
Answer:
The displacement of the athlete is zero when the athlete returns to the same starting point (origin O). This is because displacement depends only on the initial and final positions. If both are the same, the net change in position is zero.
However, the total distance travelled is not zero because the athlete has actually moved along a path.
If the athlete goes from O to A (100 m) and then comes back to O,
Total distance = 100 m + 100 m = 200 m
Displacement = 0 m
2. Fuel used up in a vehicle depends on which of the following? Justify your answer.
(i) Total distance travelled
(ii) Displacement
Answer:
Fuel used in a vehicle depends on: (i) Total distance travelled
Fuel is used when the vehicle is moving, so it depends on the actual distance covered. Even if the vehicle comes back to the starting point, it still uses fuel because it has travelled some distance.
Displacement does not matter because it only tells the starting and ending position, not how much path was covered.
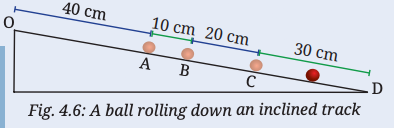
3. A ball rolls down an inclined track as shown in Fig. 4.6. Is its motion a straight line motion? Assuming the starting point of the ball (O) to be the origin, can its motion from O to D be depicted using a horizontal line as shown in Fig. 4.3? Are the values of total distance travelled and magnitude of displacement from O equal or different at positions A, B, C and D?
![]()
![]()
Answer:
Yes, the ball moves along a straight inclined path, so it is a straight-line motion. We can represent its motion from O to D using a horizontal line by measuring distances from the starting point (origin O). At positions A, B, C, and D, the total distance travelled and displacement are equal because the ball moves in one direction without turning back.
Pause and Ponder (Page 53)
4. During a family road trip, you drive 200 km north in three hours. Afterwards, you drive 200 km south in two hours. Find the average speed and average velocity for your entire trip.
5. Under what condition(s) is the
(i) magnitude of average velocity of an object equal to its average speed?
(ii) magnitude of average velocity of an object zero while its average speed is not zero?
Answer:
(4)Given:
Distance travelled north = 200 km
Distance travelled south = 200 km
Total distance $=200+200=400 \mathrm{~km}$
Total time $=3+2=5 \mathbf{~ h}$
$\text { Average speed }=\frac{\text { Total distance }}{\text { Total time }}=\frac{400}{5}=80 \mathrm{~km} / \mathrm{h}$
Average velocity: Since the final position is the same as the initial position,
Displacement = 0
$\text { Average velocity }=\frac{0}{5}=0 \mathrm{~km} / \mathrm{h}$
(5)(i) The magnitude of average velocity is equal to the average speed when the object moves in a straight line without changing direction.
(ii) The magnitude of average velocity is zero while the average speed is not zero when the object returns to its starting point, so displacement is zero but distance travelled is not zero.
Class 9 Science Chapter 4 - Describing Motion Around Us Activity Question Answer:
NCERT Class 9 Science Chapter 4 Activity 4.1: Let us analyse
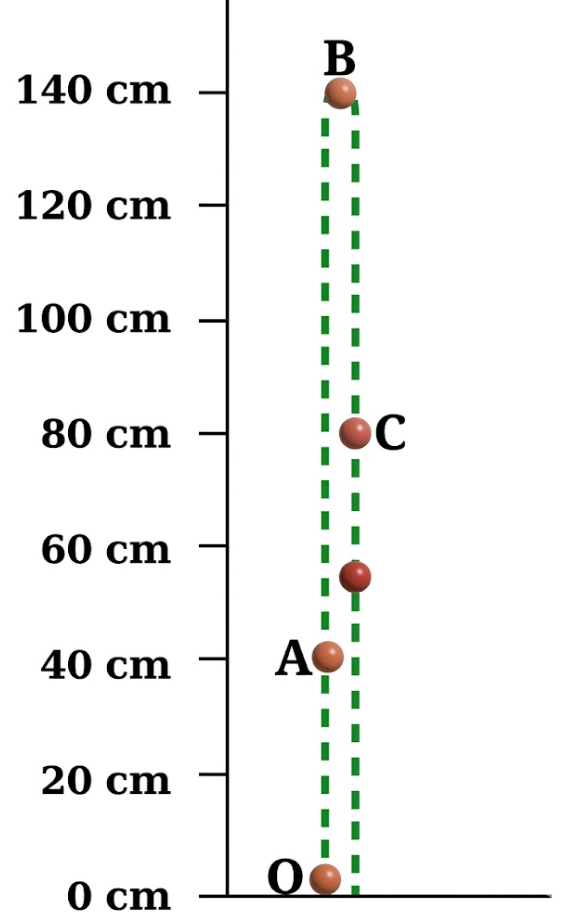
1. As shown in Fig. 4.5, a ball is thrown vertically upwards from O. It
moves up straight till B and then falls back to O. Can this be considered
a motion in a straight line?
2. For this motion, fill up the values in Table 4.1.
![]()
Fig. 4.5: A ball in vertical motion (two separate lines are shown only for clarity; in reality, the object goes up and falls back in the same straight line)
2. For this motion, fill up the values in Table 4.1.
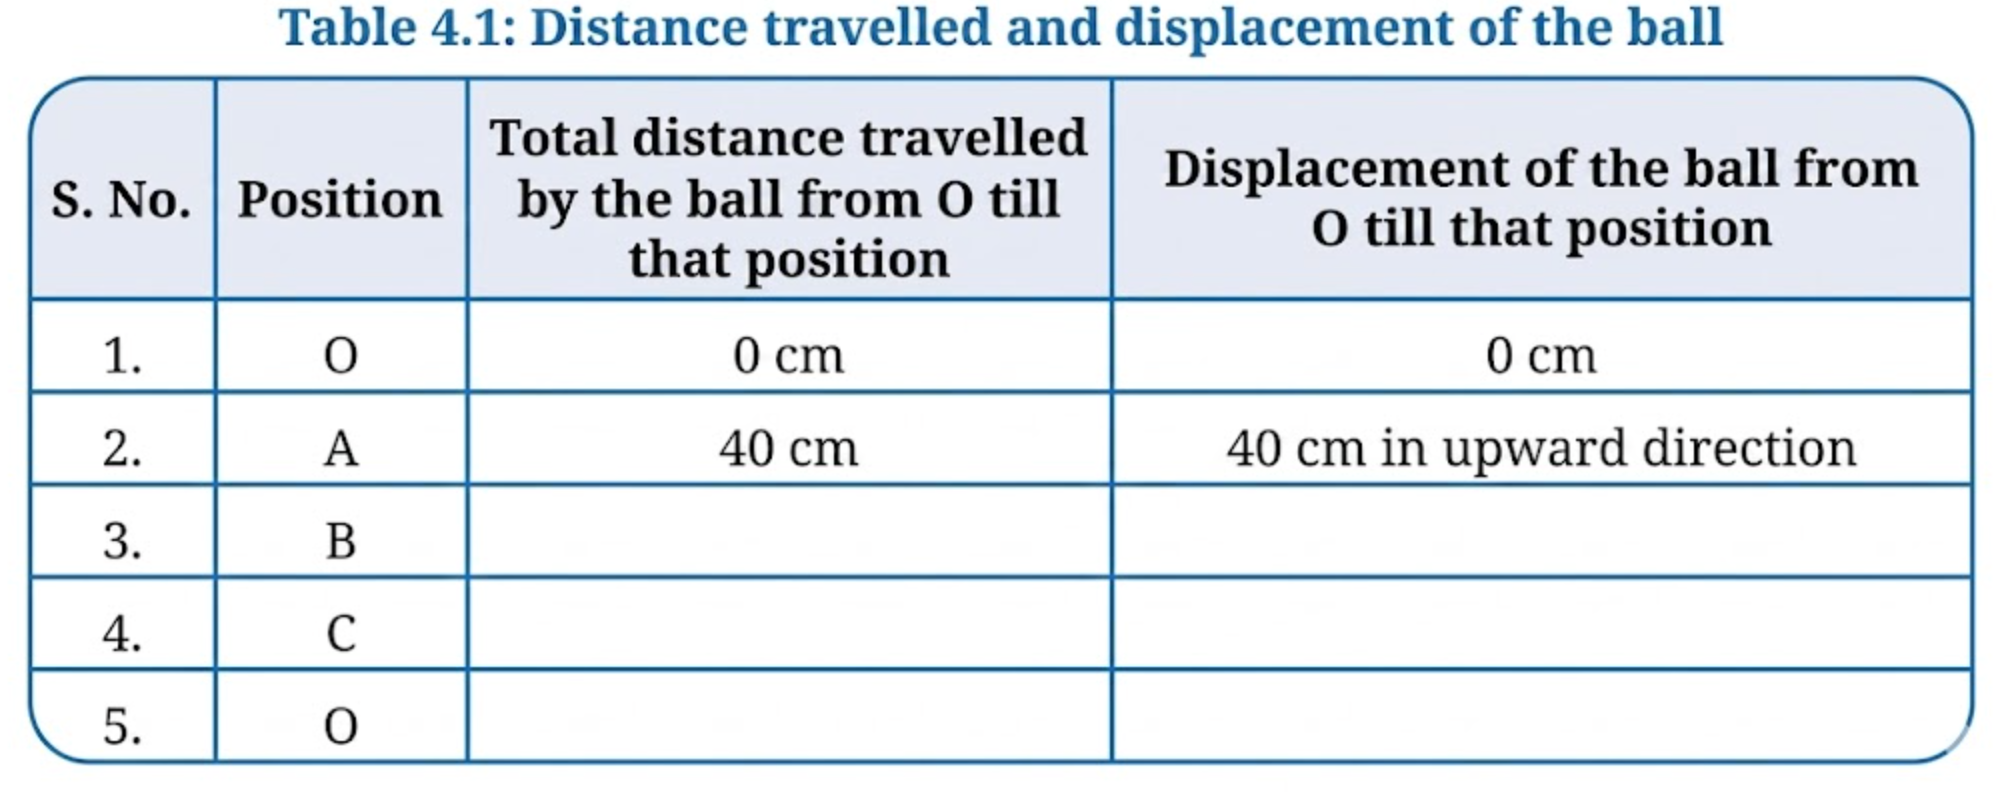
![]()
3. Analyse the data filled in Table 4.1 and choose which of the following is true for displacement:
(i) It is never zero.
(ii) Its magnitude can be greater than the total distance travelled.
(iii) Its magnitude is less than or equal to the total distance travelled.
(iv) Its magnitude is less than the total distance travelled in all cases.
Answer:
(1) Yes, this motion can be considered a straight-line motion because the ball moves only along a single vertical line. It goes straight up and then comes straight down along the same path, without changing direction sideways. So, even though the direction changes (upward to downward), the path remains straight, which makes it motion in a straight line.
(2)
|
S. No. |
Position |
Total distance travelled from O |
Displacement from O
|
|
1 |
O |
0 cm |
0 cm |
|
2 |
A |
40 cm |
40 cm upward |
|
3 |
B |
140 cm |
140 cm upward |
|
4 |
C |
200 cm |
80 cm upward |
|
5 |
O |
280 cm |
0 cm |
(3) (iii) Its magnitude is less than or equal to the total distance travelled.
Class 9 NCERT Science Chapter 4 Activity 4.2: Let us calculate
1. The magnitude of average acceleration of cars is generally specified as
the time taken by the car to go from 0 km/h to 100 km/h. Look it up
on the internet and find this time for various cars, and record those in
Table 4.2.
2. Calculate the magnitude of average acceleration for each car.
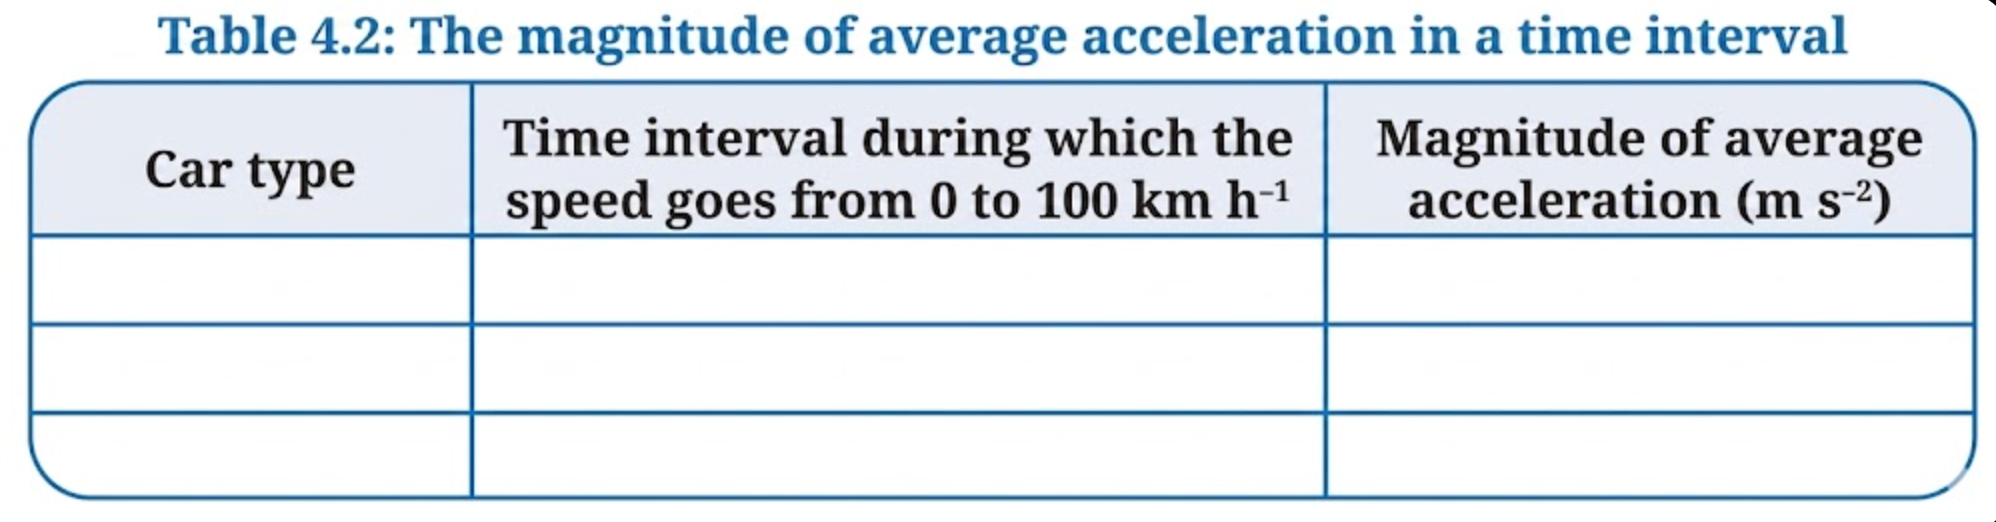
![]()
Answer
|
Car Type |
Time interval during which the speed goes from 0 to 100 km/h |
Magnitude of average Acceleration (m/s²)
|
|
Maruti Suzuki Swift |
13.5 s |
2.06 |
|
Hyundai Creta |
10.8 s |
2.57 |
|
Toyota Fortuner |
10.2 s |
2.72 |
|
Tata Nexon EV |
8.9 s |
3.12 |
Class 9 Science Chapter 4 Activity 4.3: Let us plot a graph
To plot a graph, let us use the data given in Table 4.3 for a vehicle moving
on a straight road.
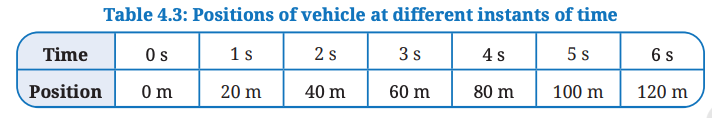
![]()
1. Take a sheet of graph paper. This paper is pre-divided into small squares (Fig. 4.11a), making it easier to plot data accurately.
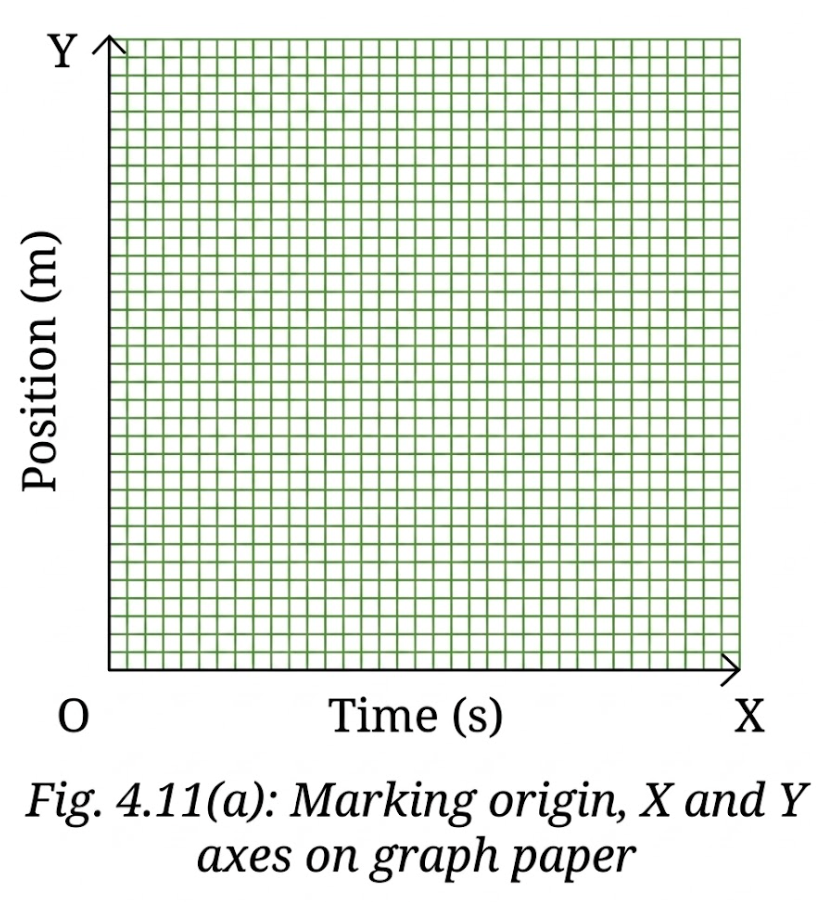
![]()
2. On the graph paper, draw two lines perpendicular to each other as shown in Fig. 4.11a. Their point of intersection is known as origin O. Mark the horizontal line as OX. It is known as the X-axis. Similarly, mark the vertical line as OY. It is called the Y-axis.
3. Refer to Table 4.3. We need to decide which quantity (time or position) to be shown along each axis. For the data we have (Table 4.3), we will show time along the X-axis and position along the Y-axis.
4. Determine a suitable scale for each quantity to represent it on the graph paper. We need to choose scales that allow us to represent the data effectively and conveniently while utilising the available space. The scale can be
X-axis: 5 divisions = 1 s
Y-axis: 5 divisions = 20 m
5. Use the chosen scale to mark values for time (1 s, 2 s, …) along the X-axis from the origin. Similarly, mark values for position (20 m, 40 m, …) along the Y-axis (Fig. 4.11b).
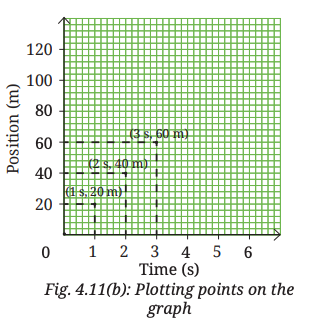
![]()
6. Begin plotting points on the graph paper to represent each set of time and position values from Table 4.3.(i) Table 4.3 shows that at time 0 s, the position is also 0 m. The point corresponding to this set of values on the graph will therefore be the origin itself. (
ii) At 1 s, the position of vehicle is at 20 m. To mark these values, look for the point that represents 1 s on the X-axis. Draw a line parallel to the Y-axis at this point. Then, draw a line parallel to the X-axis from the point corresponding to distance 20 m on the Y-axis. The point where these two lines intersect represents the position 20 m at time t = 1 s on the graph (Fig. 4.11b).
(iii) Similarly, plot on the graph paper all points corresponding to positions of the vehicle at different instants of time.
7. Once all points are plotted, connect them to create the position-time graph for the vehicle’s motion (Fig. 4.11c). It is a straight line for the data given in Table 4.3.
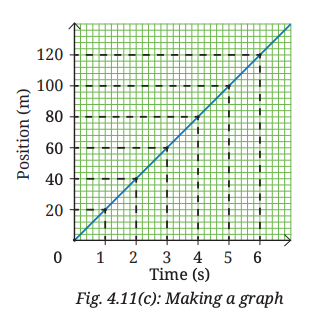
![]()
Observation:
- All the points lie on a straight line passing through the origin.
- The vehicle covers equal distances (20 m) in equal time intervals (1 s).
- The straight-line graph shows that the velocity is constant throughout the motion.
- The slope of the graph remains the same at all points, indicating uniform motion.
Explanation:
A position–time graph shows how the position of an object changes with time. When the graph is a straight line, it means the object is covering equal distances in equal intervals of time, which is called uniform motion. The slope of the graph gives the velocity of the object. In this case, velocity = 20 m ÷ 1 s = 20 m/s.
Conclusion: The object moves with constant velocity, so the motion is uniform.
Class 9 Science NCERT Chapter 4 Activity 4.4: Let us calculate
1. In the position-time graph we plotted (Fig. 4.11c), consider a part (say, AB) of the graph as shown in Fig. 4.14. From A, draw a line parallel to X-axis and another line parallel to Y-axis. Repeat the same from B.
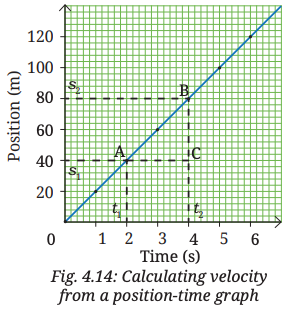
![]()
2. Extend the horizontal line from A and a triangle ABC is formed. What do the sides BC and CA of the triangle represent? BC represents the change in position $\left(s_2-s_1\right)$, and AC represents the change in time ( $t_2-t_1$ ).
3. As per Eq. (4.2a), by dividing the change in position (BC) by the change in time (CA), you get the average velocity
$v=\frac{s_2-s_1}{t_2-t_1}=\frac{\mathrm{BC}}{\mathrm{CA}}$
4. By extracting values of time $t_1$ and $t_2$, and distances $s_1$ and $s_2$ from the graph, the magnitude of average velocity can be calculated as
$v=\frac{80 \mathrm{~m}-40 \mathrm{~m}}{4 \mathrm{~s}-2 \mathrm{~s}}=\frac{40 \mathrm{~m}}{2 \mathrm{~s}}=20 \mathrm{~m} \mathrm{~s}^{-1}$
Observation:
- A triangle ABC is formed on the position–time graph.
- BC (vertical) = change in position = 80 − 40 = 40 m
- CA (horizontal) = change in time = 4 − 2 = 2 s
- Ratio BC/CA = 40/2 = 20 m/s
- This value is equal to the slope of line AB.
Explanation:
The slope of a position–time graph gives the average velocity of the object.
Here, slope = change in position ÷ change in time = 20 m/s.
Since the graph is a straight line, the slope remains the same at all points, showing that velocity is constant.
Conclusion: Average velocity can be found from the slope of the position–time graph.
NCERT Class 9 Science Chapter 4 Activity 4.5: Let us investigate
1. Take a ring, such as an adhesive tape ring and one marble.
2. Place the ring flat on a smooth surface and throw the marble inside the ring in a way that it rotates along the inner boundary of the ring (Fig. 4.24).
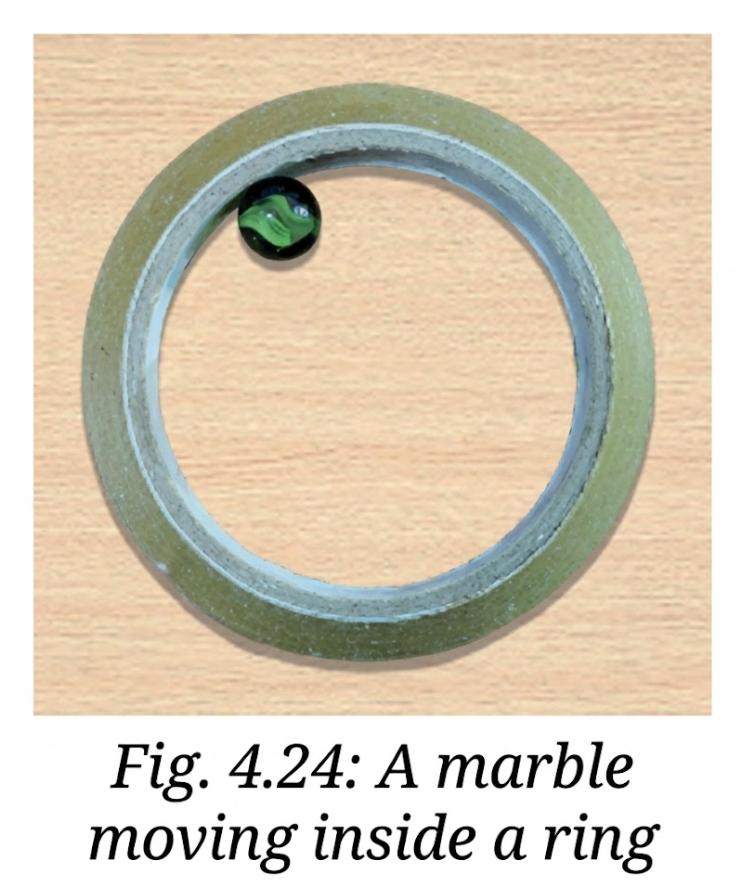
![]()
3. Predict what will happen if you lift the ring while the marble is moving.
4. Now, after one or two complete revolutions of the marble, pick up the ring without disturbing the motion of the marble. What do you observe? Does the marble continue moving in a circular motion? Or does it move in some other manner?
5. Repeat the activity multiple times to confirm the result. When the marble is released by lifting the ring, it moves in a straight line. Why does this happen?
Observation:
- When the ring is on the surface, the marble moves in a circular path along the inner boundary.
- When the ring is suddenly lifted, the marble no longer follows the circular path.
- The marble moves in a straight line tangential to the circle at the point where the ring is removed.
Explanation:
The circular motion of the marble is due to the force exerted by the ring, which provides the required centripetal force. When the ring is lifted, this force is removed. As a result, the marble continues to move in a straight line due to its inertia, following the tangent to the circular path at that instant.
Conclusion: An object in circular motion moves in a straight line (tangentially) when the centripetal force is removed.
NCERT Solution for Class 9 Science Chapter 4: Topics
- 4.1.2 Distance travelled and displacement
- 4.1.3 Average speed and average velocity
- 4.1.4 Average acceleration
4.2 Graphical Representation of Motion
- 4.2.1 Plotting graph
- 4.2.2 Position-time graphs
- 4.2.3 Velocity-time graphs
4.3 Kinematic Equations for Motion in a Straight Line with Constant Acceleration
4.4 Motion in a Plane
- 4.4.1 Uniform circular motion
Frequently Asked Questions (FAQs)
Q: Are NCERT solutions free?
A:
Yes, NCERT solutions are available for free on many educational platforms. Students can easily access them for study and revision.
Q: What is the name of Class 9 Science Chapter 4?
A:
The name of Class 9 Science Chapter 4 is Describing Motion Around Us.
Q: How to score good marks in Class 9 Science?
A:
To score good marks, understand concepts clearly, practice NCERT questions regularly, revise important topics, and solve sample papers before exams.
Q: Which is the hardest subject in Class 9?
A:
The hardest subject depends on the student. Many students find Science or Mathematics difficult, but with regular practice and clear understanding, both can become easy.
Q: What are the important questions in Motion (Class 9)?
A:
Important questions include definitions of speed, velocity, and acceleration, numerical problems based on equations of motion, and graph-based questions like distance-time and velocity-time graphs.
Q: What are NCERT solutions for Class 9 science?
A:
Articles
Upcoming School Exams

Popular Questions
A block of mass 0.50 kg is moving with a speed of 2.00 ms-1 on a smooth surface. It strikes another mass of 1.00 kg and then they move together as a single body. The energy loss during the collision is
| Option 1)
|
Option 2)
|
| Option 3)
|
Option 4)
|
An athlete in the olympic games covers a distance of 100 m in 10 s. His kinetic energy can be estimated to be in the range
| Option 1)
|
Option 2)
|
| Option 3)
|
Option 4)
|
A particle is projected at 600 to the horizontal with a kinetic energy . The kinetic energy at the highest point
| Option 1)
|
Option 2)
|
| Option 3)
|
Option 4)
|
In the reaction,
| Option 1)
|
Option 2)
|
| Option 3)
|
Option 4)
|
How many moles of magnesium phosphate, will contain 0.25 mole of oxygen atoms?
| Option 1)
0.02 |
Option 2)
3.125 × 10⁻² |
| Option 3)
1.25 × 10⁻² |
Option 4)
2.5 × 10⁻² |
Colleges After 12th