

NCERT Exemplar Class 9 Maths Solutions Chapter 14 Statistics and Probability
In the world of Mathematics, there are famous sayings: “Statistics: the only science that enables different experts using the same figures to draw different conclusions” and “Probability is not about certainty; it’s about possibility.” In simple terms, statistics help us represent large amounts of data using tables, graphs, and numbers. On the other hand, probability makes sense in terms of the likelihood of an event happening or not. In Chapter 14 Maths Exemplar Problems Class 10 Solutions, we will learn about various graphical representations of data, including the mean, median, and mode, as well as different types of probability questions.
This Story also Contains
- NCERT Exemplar Class 9 Maths Solutions Chapter 14 Statistics and Probability
- NCERT Exemplar Class 9 Maths Solutions Chapter-Wise
- Importance of NCERT Exemplar Solutions Class 9 Maths Chapter 14
- NCERT Solutions for Class 9 Mathematics: Chapter-wise
- NCERT Books and NCERT Syllabus
.jpg)
Class 9th maths NCERT exemplar includes problems that are more challenging than the regular textbook exercises and are ideal for higher classes and competitive exams. The main purpose of this NCERT exemplar class 10 Maths solutions is to make all the concepts crystal clear to students so that they can solve different kinds of problems on their own. The 2025-26 CBSE syllabus has been followed in these solutions and prepared by Careers360 experts having multiple years of experience in this field. Students can also check the NCERT books for Class 9 Maths to practice and gain knowledge.
Also, read,
NCERT Exemplar Class 9 Maths Solutions Chapter 14 Statistics and Probability
| Exercise: 14.1 Total Questions: 30 Page number: 131-136 |
Question:1
The class mark of the class 90-120 is :
$(A) \; 90$
$(B) \; 105$
$(C) \; 115$
$(D) \; 120$
Answer: BClassmark is the mid-value or the central value of a class.
It is calculated as follows:
$\frac{\text {upper limit + lower limit}}{2}$
$\Rightarrow$ Class mark $=\frac{90+120}{2}=\frac{210}{2}=105$
The class mark of class 90-120 is 105, i.e. option B.
Question:2
$\text{The range of the data}$ $:\ 25, 18, 20, 22, 16, 6, 17, 15, 12, 30, 32, 10, 19, 8, 11, 20 \ is$
$(A) \; 10$
$(B) \; 15$
$(C) \; 18$
$(D) \; 26$
The range is the difference between the largest (maximum value) and the smallest number (minimum value) of a data
$25, 18, 20, 22, 16, 6, 17, 15, 12, 30, 32, 10, 19, 8, 11, 20$
Here largest number=32
Smallest number =6
Range =32-6=26
Hence, 26 is the range of the data.
Therefore, option (D) is correct.
Question:3
In a frequency distribution, the mid-value of a class is 10, and the width of the class is 6. The lower limit of the class is :
$(A) \; 6$
$(B) \; 7$
$(C) \; 8$
$(D) \; 12$
Let x and y be the upper and lower class limits in the frequency distribution.
$\text{The mid-value of given class}=\frac{x+y}{2}$
Here, the mid-value of the class is given as 10.
$\frac{x+y}{2}=10$
$x+y=20\; \; \; \; \; \; \; \; \; \; \; \; ....(1)$
Also, given that the width of the class is 6
$x-y=6\; \; \; \; \; \; \; \; \; \; \; \; \; \; \; ...(2)$
Now, adding equations (1) and (2),
$x+y+x-y=20+6$
$x=\frac{26}{2}=13$
Putting x=13 in equation (1)
$x+y=20$
$13+y=20$
$y=20-13=7$
Hence, the lower limit of the class is 7
Therefore, option (B) is correct.
Question:4
The width of each of the five continuous classes in a frequency distribution is 5, and the lower class-limit of the lowest class is 10. The upper class-limit of the highest class is:
$(A) \; 15$
$(B) \; 25$
$(C) \; 35$
$(D) \; 40$
Here, the lower class-limit of the lowest class is 10, and the width of the class is 5
So, starting from 10, the first class will be:
$10 - 15$
Now we have been given that this is the lowest class. So next 4 continuous classes will be:
15 - 20\\ 20 - 25\\ 25 - 30\\ 30 - 35
As the total number of classes is 5, 35 is the upper limit of the highest class.
Therefore, option (C) is correct.
Question:5
Let m be the mid-point and l be the upper-class limit of a class in a continuous frequency distribution. The lower class limit of the class is :
$(A)\; 2m+l$
$(B)\; 2m-l$
$(C)\; m-l$
$(D)\; m-2l$
Given, $l$ is the upper limit of the class
Let $n$ be the lower class limit
Also given, $m$ is the mid-point of this class.
Mid-value of a class is calculated as follows:
$\frac{\text {upper limit+lower limit}}{2}$
Then, the mid-point
$m=\frac{n+l}{2}$
$2m=n+l$
Therefore, $n=2m-l$
Therefore, option (B) is correct.
Question:6
The class marks of a frequency distribution are given as follows: 15, 20, 25, ..... The class corresponding to the class mark 20 is :
$(A)\; 12.5-17.5$
$(B)\; 17.5-22.5$
$(C)\; 18.5-21.5$
$(D)\; 19.5-20.5$
The class marks of a frequency distribution are given as: 15, 20, 25, ...
Class size for the given frequency distribution is: 20-15=5
To find the class corresponding to the class mark 20:
We will use the formula
$\text{Upper limit}=\text {class mark}+\frac{\text {class size}}{2}$
$=20+\frac{5}{2}=\frac{40+5}{2}=\frac{45}{2}$
$=22.5$
$\text{Lower limit}=\text {class mark}-\frac{\text {class size}}{2}$
$=20-\frac{5}{2}=\frac{35}{2}=17.5$
Hence, 17.5-22.5 is the corresponding class to the classmark 20
Therefore, option (B) is correct.
Question:7
In the class intervals 10-20, 20-30, the number 20 is included in :
(A) 10-20
(B) 20-30
(C) both the intervals
(D) none of these intervals
Here, in these class intervals 10-20,20-30, the number 20 is included in 20-30,
Because in 10-20 there are only (10, 11....19)
And in 20-30 there are only (20, 21,.....29)
Hence, we don’t count the upper limit in every class interval.
The number is always included in the lower limit of the class interval.
Therefore, option (B) is correct.
Question:8
A grouped frequency table with class intervals of equal sizes using 250-270 (270 not included in this interval) as one of the class intervals is constructed for the following data :
$268, 220, 368, 258, 242, 310, 272, 342, 310, 290, 300, 320,319,$
$304, 402,
406, 292, 354, 278, 210, 240, 330, 316, 406, 215, 258, 236.$
The frequency of the class 310-330 is:
$\\(A)\; 4\\(B)\; 5\\(C)\; 6\\(D)\; 7$
Firstly, we will arrange the given data into intervals of equal sizes as mentioned, i.e., 210-230, 230-250 and so on.
The given data can be arranged as:
$210-230: 220, 210, 215$
$230-250: 242, 240, 236$
$ 250-270: 258, 268, 258$
$270-290: 272, 278$
$290-310: 290, 304, 300, 292$
$310-330: 310, 310, 320, 319, 318, 316$
$330-350: 342, 330$
$350-370: 368, 354$
$370-390:$ No element
$390-410: 402, 406, 406$

So, we can see that 6 is the frequency of 310-330..
Therefore, option (C) is correct.
Question:9
A grouped frequency distribution table with classes of equal sizes using 63-72 (72 included) as one of the classes is constructed for the following data :
$30, 32, 45, 54, 74, 78, 108, 112, 66, 76, 88, 40, 14, 20,15,$
$35, 44, 66, 75, 84, 95, 96, 102, 110, 88, 74, 112, 14, 34, 44.$
The number of classes in the distribution will be :
$\\(A) 9 \\ (B) 10 \\ (C) 11 \\ (D) 12$
$30, 32, 45, 54, 74, 78, 108, 112, 66, 76, 88, 40, 14, 20,$
$15, 35, 44, 66, 75, 84, 95, 96, 102, 110, 88, 74, 112, 14, 34, 44.$
The minimum number in the data is 14, and the maximum number is 112.
Classes of equal sizes using 63-72 are to be constructed.
So, the intervals are as follows:
13-22, 23-32, 33-42, 43-52, 53-62, 63-72, 73-82, 83-92, 93-102, 103-112
The number of class intervals is 10.
Therefore, option B is correct.
Question:10
To draw a histogram to represent the following frequency distribution :
|
Class interval
|
$5-10$
|
$10-15$
|
$15-25$
|
$25-45$
|
$45-75$
|
|
Frequency
|
$6$
|
$12$
|
$10$
|
$8$
|
$15$
|
$\\(A) 6 \\ (B) 5\\ (C) 3 \\ (D) 2$
Answer : D
In the given data, we have to find the width to adjust the frequency.
We have, width = 10 - 5 = 5
Width of 25-45 = 45 -25 = 20
So interval 25-45 includes 4 classes with class interval 5
$\text {AF}=\frac{\text {given frequency}\times \text {lower limit}}{\text {Class width}}$
$=\frac{8 \times 5}{20}=\frac{8}{4}=2$
Therefore, option (D) is correct.
Question:11
$\\(A) 28\\ (B) 30\\ (C) 35\\ (D) 38$
Answer : DLet the numbers be
$a+b+c+d+e$
$\Rightarrow$ $Mean =\frac{a+b+c+d+e}{5}=30$
$\Rightarrow a+b+c+d+e=30 \times 5=150\; \; \; \; \; \; \; \; \; \; \; \; ....(i)$
Let the excluded number be a
New mean =28
$\Rightarrow \frac{b+c+d+e}{4}=28$
$\Rightarrow b+c+d+e=28\times 4=112$
Putting the value of b+c+d+e in equation (i)
$a+112=150$
$\Rightarrow a=150-112$
$\Rightarrow a=38\; \; \; \; \; \; \; \; \; \; \rightarrow\text{excluded number}$
Therefore, option (D) is correct.
Question:12
If the mean of the observations x, x + 3, x + 5, x + 7, x + 10 is 9, the mean of the last three observations is
$(A)\ 10\frac{1}{3}$
$(B) \ 10\frac{2}{3}$
$(C)\ 11\frac{1}{3}$
$(D)\ 11\frac{2}{3}$
Answer:
In the given data the mean of the observations x, x + 3, x + 5, x + 7, x + 10 is given as 9$\Rightarrow$ $Mean=\frac{x+x+3+x+5+x+7+x+10}{5}=9$
$\Rightarrow 5x+25=45$
$\Rightarrow 5x=45-25$
$\Rightarrow 5x=20$
$\Rightarrow x=\frac{20}{5}=4$
$\therefore$ Last three observations are
$x + 5, x + 7, x + 10$
$= 4 + 5, 4 + 7, 4 + 10 = 9, 11, 14$
$\therefore$ So, the mean of the last three observations
$\Rightarrow \frac{9+11+14}{3}=\frac{34}{3}=11\frac{1}{3}$
Therefore, option (C) is correct.
Question:13
$\text{If x represents the mean of n observations }\sum_{i=l}^{n}\left ( x_{i}-\bar{x} \right )x_{1},x_{2}......x_{n},$
$\text{then value of}$ $\sum_{i=l}^{n}\left ( x_{i}-\bar{x} \right )\text{ is}$
(A) -1
(B) 0
(C) 1
(D) n-1
Here, we are given,
$\sum_{i=l}^{n}\left ( x_{i}-\bar{x} \right )$
$\Rightarrow \bar{x}\text{ is the mean of all observations. }$
$\text {mean}=\frac{\text {sum of observations}}{\text {Number of observations}}$
$\bar{x}=\frac{\left ( x_{1}+x_{2}+x_{3}+......+x_{n} \right )}{n}$
$\Rightarrow n\bar{x}=\left ( x_{1}+x_{2}+.....+x_{n} \right )$
$\Rightarrow n\bar{x}=\sum_{i=1}^{n}x_{i}$
$\Rightarrow \sum_{i=1}^{n}x_{i}-n\bar{x}=0$
$\Rightarrow \sum_{i=1}^{n} \left ( x_{1}-\bar{x} \right )=0$
Here, the value of
$\sum_{i=1}^{n} \left ( x-\bar{x} \right )=0$
Therefore, option (B) is correct.
Question:14
If each observation of the data is increased by 5, then their mean
(A) remains the same
(B) becomes 5 times the original mean
(C) is decreased by 5
(D) is increased by 5
Let $x_{1},x_{2}......x_{n}$ be the n observations.
$\Rightarrow$ old mean
$\bar{x}_{old}=\frac{\sum_{i=1}^{n}x_{i}}{n} \; \; \; \; \; \; \; \; \; ..(i)$
Now, adding $5$ to each observation, the new mean becomes.
$\bar{x}_{new}=\frac{\left ( x_{1}+5 \right )+\left ( x_{2}+5 \right )+....+\left ( x_{n}+5 \right )}{n}$
$\bar{x}_{new}=\frac{\left ( x_{1}+x_{2}+.....+x_{n} \right )+\left ( 5+5+5..... \right ) \text {n times}}{n}$
$\bar{x}_{new}=\frac{\left ( x_{1}+x_{2}+.....+x_{n} \right )+5n}{n}$
$\bar{x}_{new}=\frac{\sum_{i=1}^{n}x_{i}}{n}+5=\bar{x}_{old}+5$ (from eq. (i))
$\bar{x}_{new}=\bar{x}_{old}+5$
Hence, the new mean is increased by 5.
Therefore, option (D) is correct.
Question:15
Let $\bar{x}$ be the mean of $x_1,\ x_2........., x_n$ and $\bar{y}$ the mean of $y_{1}, y_{2}, ... , y_{n}$.
If $\bar{z}$ is the mean of $x_1,\ x_2........., x_n$, $y_{1}, y_{2}, ... , y_{n}$ then $\bar{z}$ is equal to:
$(A)$ $\bar{x}+\bar{y}$
$(B)$ $\frac{\bar{x}+\bar{y}}{2}$
$(C)$ $\frac{\bar{x}+\bar{y}}{n}$
$(D)$ $\frac{\bar{x}+\bar{y}}{2n}$
$\bar{x}$ is the mean of $x_{1},x_{2},.....,x_{n}$ then
$\bar{x}=\frac{x_{1}+x_{2}+.....+x_{n}}{n}$
$\bar{y}$ is the mean of $y_{1},y_{2},......y_{n}$ then
$\bar{y}=\frac{y_{1}+y_{2}+......y_{n}}{n}$
$\bar{z}$ is the mean of $x_{1},x_{2},.......x_{n},y_{1},y_{2}............,y_{n}$
$\bar{z} = \frac{x_{1}+x_{2}+........+x_{n}+y_{1}+y_{2}+.....y_{n}}{2n}$
$\bar{z} = \frac{1}{2}\left ( \frac{x_{1}+x_{2}+....+x_{n}+y_{1}+y_{2}+.......y_{n}}{n} \right )$
$\bar{z} = \frac{1}{2}\left ( \frac{x_{1}+x_{2}+....+x_{n}}{n} +\frac{y_{1}+y_{2}+.......y_{n}}{n}\right )$
$\bar{z} = \frac{\bar{x}+\bar{y}}{2}$
Hence, the value of $\bar{z}$ is $\frac{\bar{x}+\bar{y}}{2}$
Therefore, option (B) is correct.
Question:16
If $\bar{x}$ is the mean of $x_{1},x_{2},........,x_{n}$,
$\text{then for}$ $a\neq 0,$ $\text{the mean of }$$ax_{1},ax_{2},........ax_{n},\frac{x_{1}}{a},\frac{x_{2}}{a},........,\frac{x_{n}}{a}$ is:
$(A)$ $\left ( a+\frac{1}{a} \right )\bar{x}$
$(B)$ $\left ( a+\frac{1}{a} \right )\frac{\bar{x}}{2}$
$(C)$$\left ( a+\frac{1}{a} \right )\frac{\bar{x}}{n}$
$(D)$$\frac{\left ( a+\frac{1}{a} \right )\bar{x}}{2n}$
$\frac{x_{1}+x_{2}...+x_{n}}{n}=\bar{x} \; \; \; \; \; \; \; \; ....(i)$
Multiply both sides by a
$\frac{ax_{1}+ax_{2}...+ax_{n}}{n}=a\bar{x} \; \; \; \; \; \; \; \; ....(i)$
$ax_{1}+ax_{2}......ax_{n}=na\bar{x}\; \; \; \; \; \; \; \; \; \; .....(ii)$
Dividing (i) by a, we get
$\frac{\frac{x_{1}}{a}+\frac{x_{2}}{a}.......+\frac{x_{n}}{a}}{n}=\frac{\bar{x}}{a}$
$\frac{x_{1}}{a}+\frac{x_{2}}{a}.......+\frac{x_{n}}{a}=\frac{n\bar{x}}{a}\; \; \; \; \; \; \; .....(iii)$
The mean of
$ax_{1}+ax_{2}.........+ax_{n}+$ $\frac{x_{1}}{a},\frac{x_{2}}{a}.......\frac{x_{n}}{a}$ $\text{is :}$
$\frac{ax_{1}+ax_{2}+ax_{n}+\frac{x_{1}}{a}+\frac{x_{2}}{a}+.......+\frac{x_{n}}{a}}{2n}$
From (ii) and (iii), we get
$\frac{ax_{1}+ax_{2}+ax_{n}+\frac{x_{1}}{a}+\frac{x_{2}}{a}+.......+\frac{x_{n}}{a}}{2n}=\frac{\left ( na\bar{x}+n\frac{\bar{x}}{a} \right )}{2n}$
$=\frac{\bar{x}n}{2n}\left ( a+\frac{1}{a} \right )$
$=\frac{\bar{x}}{2}\left ( a+\frac{1}{a} \right )$
Therefore, option (B) is correct.
Question:17
If $\bar{x}_{1},\bar{x}_{2},\bar{x}_{3},........\bar{x}_{n},$ are the means of n groups with $n_{1},n_{2},......n_{n}$ number of observations respectively, then the mean $\bar{x}$ of all the groups taken together is given by :
$(A)$ $\sum_{i=1}^{n}n_{i}\bar{x}_{i}$
$(B)$ $\frac{\sum_{i=1}^{n}n_{i}\bar{x}_{i}}{n^{2}}$
$(C)$ $\frac{\sum_{i=1}^{n}n_{i}\bar{x}_{i}}{\sum_{i=1}^{n}n_{i}}$
$(D)$ $\frac{\sum_{i=1}^{n}n_{i}\bar{x}_{i}}{2n}$
$\text {Mean is defined as}\; \bar{x}=\frac{\text {sum of observations}}{\text {Number of observations}}$
$\Rightarrow$ Sum of observations = (mean) (Number of observations).
Given : $\bar{x}_{1},\bar{x}_{2},\bar{x}_{3},........\bar{x}_{n}$ are the means of n groups with $n_{1},n_{2},......n_{n}$ number of observations respectively.
$\sum x_{1}=\bar{x}_{1}n_{1}$
$\sum x_{2}=\bar{x}_{2}n_{2}$
$\sum x_{n}=\bar{x}_{n}n_{n}$
Now all the groups are taken together
Sum of all the observations:
$\sum x_{1}+\sum x_{2}+.......+\sum x_{n}=\bar{x}_{1}n_{1}+\bar{x}_{2}n_{2}+....+\bar{x}_{n}n_{n}$
Mean of all observations:
$\bar{x}=\frac{\bar{x}_{1}n_{1}+\bar{x}_{2}n_{2}+.....+\bar{x}_{n}n_{n}}{n_{1}+n_{2}+.......+n_{n}}=$$\frac{\sum_{i=1}^{n}n_{i}\bar{x}_{i}}{\sum_{i=1}^{n}n_{i}}$
Therefore, option (C) is correct.
Question:18
The mean of 100 observations is 50. If one of the observations, which was 50, is replaced by 150, the resulting mean will be :
(A) 50.5
(B) 51
(C) 51.5
(D) 52
Given that the mean of 100 observations is 50.
$\Rightarrow \text {mean}=\frac{\text {sum of observation}}{\text {No.of observation}}$
Here number of obervations 100
Let the sum of 50 observations be x
$\Rightarrow 50=\frac{x}{100}$
$\Rightarrow x=50\times100=5000$
Given that one observation 50 is replaced by 150
$New \ sum=x-50+150=5000-50+150=5100$
$New \ mean=\frac{5100}{100}=51$
Hence, the mean is 51
Therefore, option (B) is correct.
Question:19
There are 50 numbers. Each number is subtracted from 53, and the mean of the numbers so obtained is found to be -3.5. The mean of the given numbers is :
(A) 46.5
(B) 49.5
(C) 53.5
(D) 56.5
Given that there are 50 numbers.
Let the numbers be
$x,y,z.........\left ( 50\; nos. \right )$
$\text {Mean is defined as }=\frac{\text {sum of observations}}{\text {Number of observations}}$
$\text {Original mean }=\frac{(x+y+z+......)}{50}$
Each number is subtracted from 53
New numbers =53-x,53-y,53-z......
Sum of new numbers =53-x+53-y+53-z+......
The new mean is given as -3.5
$-3.5=\frac{53-x+53-y+53-z+.....}{50}$
$-3.5=\frac{\left ( 53 \right )\left ( 50 \right )-\left ( x+y+z+..... \right )}{50}$
$-3.5=\frac{(53)(50)}{50}-\frac{\left ( x+y+z+.... \right )}{50}$
$-3.5=53-\text {original mean}$
Original mean =53+3.5=56.5
Therefore, option (D) is correct.
Question:20
The mean of 25 observations is 36. Out of these observations, if the mean of the first 13 observations is 32 and that of the last 13 observations is 40, the 13th observation is :
$\\(A) 23 \\ (B) 36\\ (C) 38 \\ (D) 40$
$\text {Mean}=\frac{\text {Sum of observations}}{\text {No.of observation}}$
The mean of $25$ observations is $36$.
$36=\frac{\text {sum of 25 observations}}{25}$
$\Rightarrow$ Sum of 25 observations =900.
For the first 13 observations, the mean is given as 32
$32=\frac{\text {sum of 13 observations}}{13}$
$\Rightarrow$ Sum of last 13 observations
$=40 \times 13 = 520$
Now, 13th observation
= sum of 13 observations+sum of last 13 observations-sum of 25 observations.
$\Rightarrow$ 13th observation =416+520-900=36
The value of the 13th observation is 36
Therefore, option (B) is correct.
Question:21
The median of the data 78, 56, 22, 34, 45, 54, 39, 68, 54, 84 is
$\\(A) 45\\ (B) 49.5\\ (C) 54\\ (D) 56$
Given terms: 78, 56, 22, 34, 45, 54, 39, 68, 54, 84
To calculate the median, arrange the given data in ascending order and then find the middle term. This middle term is called the median.
In ascending order:
$22, 34, 39, 45, 54, 54, 56, 68, 78, 84$
Number of terms
$=10\left ( \text {even} \right )$
$\text {Median}=\text {average of }\left ( \frac{n}{2} \right )^{th}\; \text {and}\; \left ( \frac{n}{2}+1 \right )^{th} \text {term}$
$\left ( \frac{n}{2} \right )^{th}\text {term}=\left ( \frac{10}{2} \right )^{th}=5^{th}\text {term}=54$
$\text {Median}=\frac{\text {term}+\text {6th term}}{2}=\frac{108}{2}=54$
Therefore, option (C) is correct.
Question:22
For drawing a frequency polygon of a continuous frequency distribution, we plot the points whose ordinates are the frequencies of the respective classes and abscissae are respectively :
(A) upper limits of the classes
(B) lower limits of the classes
(C) class marks of the classes
(D) upper limits of preceding classes
To draw a frequency polygon of a continuous frequency distribution, we plot the frequency of the classes on the ordinates and the class marks of the classes on the abscissae.
Class mark is the mid-value or the central value of a class
It is calculated as follows:
$\frac{\text {upper limit+lower limit}}{2}$
For example
|
Class interval
|
Class marks (x-coordinate)
|
Frequency (y-coordinate)
|
|
10-20
|
15
|
7
|
|
20-30
|
25
|
8
|
|
30-40
|
35
|
9
|
Question:23
Median of the following numbers: 4, 4, 5, 7, 6, 7, 7, 12, 3 is
$\\(A) 4\\ (B) 5\\ (C) 6\\ (D) 7$
Given numbers: 4, 4, 5, 7, 6, 7, 7, 12, 3
To calculate the median, arrange the given data in ascending order and then find the middle term. This middle term is called the median.
Firstly, we will arrange the numbers in ascending order –
$3, 4, 4, 5, 6, 7, 7, 7, 12$
There are $9$ number of observations.
For an odd number of observations, the middle term
$=\left ( \frac{n+1}{2} \right )^{th}\text {term}=\left ( \frac{9+1}{2} \right )^{th}\text {term}=\left ( \frac{10}{2} \right )^{th}\text {term}=5^{th}\text {term}$
5th term is 6, hence it is the required median.
Therefore, option (C) is correct.
Question:24
Mode of the data 15, 14, 19, 20, 14, 15, 16, 14, 15, 18, 14, 19, 15, 17, 15 is
(A) 14
(B) 15
(C) 16
(D) 17
Mode is the value that occurs the most number of times in a given set of values
Given data, 15, 14, 19, 20, 14, 15, 16, 14, 15, 18, 14, 19, 15, 17, 15
Arranging in ascending order
14, 14, 14, 14, 15, 15, 15, 15, 15, 16, 17, 18, 19, 19, 20
Here, 15 occurs 5 times, which is the most number of times in the given set of values.
Mode =15
Therefore, option (B) is correct.
Question:25
In a sample study of 642 people, it was found that 514 people have a high school certificate. If a person is selected at random, the probability that the person has a high school certificate is :
$\\(A) 0.5\\ (B) 0.6\\ (C) 0.7\\ (D) 0.8$
We will use the formula of probability:-
$\text {P}=\frac{\text {favourable outcome}}{\text {Total possible outcome}}$
Total possible outcomes =642
Favourable outcomes =514
Required probability
$=\frac{514}{642}=0.800$
So if a person is selected at random, the probability that the person has a high school certificate is 0.8
Therefore, option (D) is correct.
Question:26
In a survey of 364 children aged 19-36 months, it was found that 91 liked to eat potato chips. If a child is selected at random, the probability that he/she does not like to eat potato chips is:
$\\(A) 0.25\\ (B) 0.50\\ (C) 0.75\\ (D) 0.80$
In a survey of 364 children aged 19-36 months, it was found that 91 liked to eat potato chips.
If a child is selected at random, the probability that he/she likes to eat potato chips is
$=\frac{91}{364}$
If a child is selected at random, the probability that he/she does not like to eat potato chips is
$=1-\frac{91}{364}$
$=\frac{364-91}{361}=\frac{273}{361}=0.756$
In the options given, the closest to 0.756 is 0.75
Therefore, option (C) is correct.
Question:27
In a medical examination of students of a class, the following blood groups are recorded:
|
Blood Group
|
A
|
AB
|
B
|
O
|
|
Number of students
|
10
|
13
|
12
|
5
|
$(A)\ \frac{1}{4}$
$(B)\ \frac{13}{40}$
$(C)\ \frac{3}{10}$
$(D)\ \frac{1}{8}$
Answer: B
$\text {P}=\frac{\text {favourable outcomes}}{\text {Total possible outcome}}$
Number of students with blood group B =12
Total number of students =10+13+12+5
Required probability
$=\frac{12}{10+13+12+5}=\frac{12}{40}=\frac{3}{10}$
Therefore, option (B) is correct.
Question:28
Two coins are tossed 1000 times, and the outcomes are recorded as below :
|
Number of heads
|
2
|
1
|
0
|
|
Frequency
|
200
|
550
|
250
|
$(A)\ \frac{1}{5}$
$(B)\ \frac{1}{4}$
$(C)\ \frac{4}{5}$
$(D)\ \frac{3}{4}$
Answer: C
Total number of outcomes =200+550+250=1000
At most one head = 0head+ 1 head
Number of favourable outcomes =250+550=800
Probability will be
$=\frac{800}{1000}=\frac{4}{5}$
Therefore, option (C) is correct.
Question:29
|
Life time (in hours)
|
300
|
500
|
700
|
900
|
1100
|
|
Frequency
|
10
|
12
|
23
|
25
|
10
|
$(A)\ \frac{1}{80}$
$(B)\ \frac{7}{16}$
$(c)\ 0$
$(D)\ 1$
Answer: C
$\text {P}=\frac{\text {favourable outcome}}{\text {Total outcomes}}$
Bulb’s life is given as $1150$ hours.
From the table, we can see that no bulb has a life as$1150$ hours.
So, favourable outcomes $=0$
Required probability $=\frac{0}{10+12+23+25+10}=0$
Therefore, option (C) is correct.
Question:30
|
Life time (in hours)
|
300
|
500
|
700
|
900
|
1100
|
|
Frequency
|
10
|
12
|
23
|
25
|
10
|
$(A)\ \frac{11}{40}$
$(B)\ \frac{5}{16}$
$(C)\ \frac{7}{16}$
$(D) \ \frac{9}{16}$
Answer: D
$\text {P}=\frac{\text {favourable outcome}}{\text {Total outcomes}}$
Bulb’s life is given as less than 900 hours = Bulbs with life 300, 500 and 700 hours
From the table, we can see that bulbs with life less than 900 hours =10+12+23
$\text {P}=\frac{\text {favourable outcome}}{\text {Total favourable outcomes}}=\frac{45}{10+12+23+25+10}$
$=\frac{45}{80}=\frac{9}{16}$
Therefore, option (D) is correct.
| Exercise: 14.2 Total Questions: 10 Page number: 136-138 |
Question:1
|
Marks
|
0-20
|
20-40
|
40-60
|
60-100
|
|
Number of Students
|
10
|
15
|
20
|
25
|
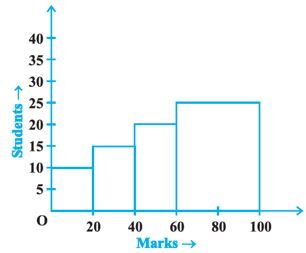
Do you think this representation is correct? Why?
Answer: Yes
Given :
|
Marks
|
0-20
|
20-40
|
40-60
|
60-100
|
|
Number of Students
|
10
|
15
|
20
|
25
|
|
Class interval (x-axis)
|
Frequency (y-axis)
|
|
0-20
|
10
|
|
20-40
|
15
|
|
40-60
|
20
|
|
60-100
|
25
|
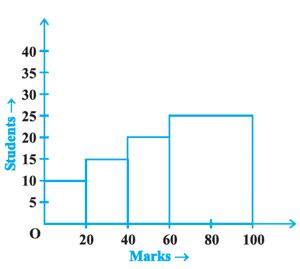
Hence, the given graph is correct.
Question:2
In a diagnostic test in mathematics given to students, the following marks (out of 100) are recorded:
$46, 52, 48, 11, 41, 62, 54, 53, 96, 40, 98, 44$
Which ‘average’ will be a good representative of the above data and why?
Given data is: $46, 52, 48, 11, 41, 62, 54, 53, 96, 40, 98, 44$
The mode is best used with categorical data.
Mean is best used with continuous and symmetrical data.
Median is best used with skewed distributions as we can find the middle of the data set.
In ascending order, we have:
$11, 40, 41, 44, 46, 48, 52, 53, 54, 62, 96, 98.$
In this case,
Median will be a good representative of the data because each value occurs once, hence, we can draw a line right at the middle of the data.
Hence, the correct answer is median.
Question:3
Answer: The child has not arranged the data in ascending order before finding the medianTo calculate the median, arrange the given data in ascending order and then find the middle term. This middle term is called the median.
Firstly, we will arrange the given data in ascending order as,
$3, 5, 14, 18, 20.$
Total number of terms = 5( odd )
$\text{Middle term }=( \frac{n+1}{2})^{th}\ \text{term}$
(where n is the number of terms)
$\text{Middle term}=( \frac{5+1}{2} )^{th}\text { term = 3rd term =14}$
So the median is not 18
The child has not arranged the data in ascending order before finding the median.
Question:4
A football player scored the following number of goals in the 10 matches: 1, 3, 2, 5, 8, 6, 1, 4, 7, 9
Since the number of matches is 10 (an even number), therefore, the median
$=\frac{5th\; \text {observation}+6th \; \text {observation}}{2}$
$=\frac{8+6}{2}=7$
Is it the correct answer, and why?
Answer:
Answer : [No, as the data is not arranged in ascending order before finding the middle terms]
Given terms: 1, 3, 2, 5, 8, 6, 1, 4, 7, 9
To calculate the median, arrange the given data in ascending order and then find the middle term. This middle term is called the median.
Firstly, we will arrange the data in ascending order as:
$1, 1, 2, 3, 4, 5, 6, 7, 8, 9.$
Here, the total number of observations, n=10 which is even.
In case of an even number of terms:
$\text{Median = average of }( \frac{n}{2} )^{th}$ $\text{ and}$ $\left ( \frac{n}{2}+1 \right )^{th}\text{ term}$
$\text{Median} =\frac{\left ( \frac{n}{2} \right )^{th}observation+\left [ \frac{n}{2}+1 \right ]^{th}observation}{2}$
$\Rightarrow \frac{\left ( \frac{10}{2} \right )^{th}observation+\left [ \frac{10}{2}+1 \right ]^{th}observation}{2}$
$\Rightarrow \frac{5^{th}\; \text {observation}+6^{th}\text {observation}}{2}$
$\Rightarrow \frac{4+5}{2}=\frac{9}{2}=4.5$
Hence, the median is 4.5.
Question:5
Answer: NoIn a histogram, the area of each rectangle is proportional to the frequency of its class.
The frequency of a class may change for any class interval. But for a specific class, the class size will remain the same.
We know that the frequency is represented on the y-axis and class size on the x-axis.
So we can say that for all the rectangles of a histogram, width (class size) remains the same & length (frequency) changes.
Hence, the correct statement is that in a histogram, the area of each rectangle is proportional to the frequency of its class.
Question:6
The class marks of a continuous distribution are :
$1.04, 1.14, 1.24, 1.34, 1.44, 1.54\text { and}\ 1.64$
Is it correct to say that the last interval will be 1.55 - 1.73? Justify your answer.
$\Rightarrow$ So, the difference between two consecutive class marks is always equal to the class size.
|
Class-marks
|
Difference
|
|
1.14-1.04
|
0.1
|
|
1.24-1.14
|
0.1
|
|
1.34-1.24
|
0.1
|
|
1.44-1.34
|
0.1
|
|
1.54-1.44
|
0.1
|
|
1.55-1.73
|
0.8
|
Hence, it cannot be the correct class interval for the given class marks.
Question:7
|
Number of hours
|
0-5
|
5-10
|
10-15
|
15-20
|
|
Frequency
|
8
|
16
|
4
|
2
|
Answer: No
Total number of students who watched TV for 10 or more hours are:
From the table:
C.I. = frequency
10-15= children
10-20 children
Total = 6 children
Hence, the total number of students who watched TV for 10 or more hours is 6 and not 22.
Question:8
Can the experimental probability of an event be a negative number? If not, why?
Answer: NoProbability of a number is determined by: Favourable Events / Total Events
Now, the number of trials in which the event can happen cannot be negative. So, the total number of trials is always positive. Hence, the experimental probability of an event is always positive.
Question:9
Can the experimental probability of an event be greater than 1? Justify your answer.
Answer: NoWe know that,
$\text {Probability}=\frac{\text {No. of favourable outcomes}}{\text {Total number of outcomes}}$
As we know, the value of favourable outcomes can never be greater than the total outcomes.
So, the probability can never be greater than 1. The probability of an event can be between only 0 and 1.
Hence, the experimental probability of an event can never be greater than 1
Question:10
Answer: NoAs the number of tosses of a coin increases, we may have a head or a tail as an outcome.
Probability of 0.5 is achieved when the total number of heads = the total number of tails.
So, obviously, we can say that it is not necessary that the favourable outcomes of tails will be equal to favourable outcomes of heads.
So, this ratio may or may not be 0.5.
For example, if we toss for three times and one head is obtained,
$\text{so ratio}=\frac{1}{3}\neq \frac{1}{2}$
$\text{If we toss for three times and two heads are obtained,}$
$\text{so ratio}=\frac{2}{3}\neq \frac{1}{2}$
$\text{If we toss four times and no head is obtained,}$
$\text{so ratio}=\frac{0}{4}\neq \frac{1}{2}$
$\text{If we toss four times and 2 heads are obtained,}$
$\text{ so ratio }=\frac{2}{4}= \frac{1}{2}$
So, we are not sure what the ratio will be.
Hence, the given statement is not true.
| Exercise: 14.3 Total Questions: 20 Page number: 140-145 |
Question:1
The blood groups of 30 students are recorded as follows:
A, B, O, A, AB, O, A, O, B, A, O, B, A, AB, B, A, AB, B, A, A, O, A, AB, B, A, O, B, A, B, A
Prepare a frequency distribution table for the data.
Answer:
Given data :A, B, O, A, AB, O, A, O, B, A, O, B, A, AB, B, A, AB, B,
A, A, O, A, AB, B, A, O, B, A, B, A
This can be arranged as:
A, A, A, A, A, A, A, A, A, A, A, A
B, B, B, B, B, B, B, B
AB, AB, AB, AB
O, O, O, O, O, O
Frequency Table can be represented as:
|
Blood group
|
Frequency distribution table
|
|
A
|
12
|
|
B
|
8
|
|
AB
|
4
|
|
O
|
6
|
|
Total
|
30
|
Question:2
Answer:
We have to make a frequency distribution of the digits 0 to 9 after the decimal point.The digits are:
$1, 4, 1, 5, 9, 2, 6, 5, 3, 5, 8, 9, 7, 9, 3, 2, 3,$
$ 8, 4, 6, 2, 6, 4, 3, 3, 8, 3, 2, 7, 9, 5, 0, 2, 8, 8$
Hence, the frequency distribution table can be represented as:
|
Digit
|
Frequency
|
|
0
|
1
|
|
1
|
2
|
|
2
|
5
|
|
3
|
6
|
|
4
|
3
|
|
5
|
4
|
|
6
|
3
|
|
7
|
2
|
|
8
|
5
|
|
9
|
4
|
|
Total
|
35
|
Question:3
The scores (out of 100) obtained by 33 students in a mathematics test are as follows:
69, 48, 84, 58, 48, 73, 83, 48, 66, 58, 84, 66, 64, 71, 64, 66,$
$ 69, 66, 83, 66, 69, 71, 81, 71, 73, 69, 66, 66, 64, 58, 64, 69, 69$
Represent this data in the form of a frequency distribution.
Answer:
Given data :
$69, 48, 84, 58, 48, 73, 83, 48, 66, 58, 84, 66, 64, 71, 64, 66, 69, 66, 83, $
$66, 69, 71, 81, 71, 73, 69, 66, 66, 64, 58, 64, 69, 69$
The data can be arranged in ascending order as:
$48, 48, 48, 58, 58, 58, 64, 64, 64, 64, 66, 66, 66, 66, 66, 66, 66, 69,$
$ 69, 69, 69, 69, 69, 71, 71, 71, 73, 73, 81, 83, 83, 84, 84$
Frequency distribution table:
$
\begin{array}{|l|l|}
\hline \text { Scores }(X) & \text { No.of students (f) } \\
\hline 48 & 3 \\
\hline 58 & 3 \\
\hline 64 & 4 \\
\hline 66 & 7 \\
\hline 69 & 6 \\
\hline 71 & 3 \\
\hline 73 & 2 \\
\hline 81 & 1 \\
\hline 83 & 2 \\
\hline 84 & 2 \\
\hline & N=33 \\
\hline
\end{array}
$
Question:4
Prepare a continuous grouped frequency distribution from the following data:
|
Mid-Point |
Frequency |
|
5 |
4 |
|
15 |
8 |
|
25 |
13 |
|
35 |
12 |
|
45 |
6 |
Also, find the size of class intervals.
Answer:
Classmark is the mid-value or the central value of a class
It is calculated as follows :
$\frac{\text {upper limit}+\text {lower limit}}{2}$
Here, midpoints are given as 5, 15, 25, 35, 45
So corresponding classes will be: 0-10, 10-20, 20-30, 30-40, 40-50
The given frequencies are :
0-10: 4, 10-20: 8, 20-30: 13, 30-40: 12, 40-50: 6
Continuous grouped frequency distribution table:

Hence, the class size is 10
Question:5
Convert the given frequency distribution into a continuous grouped frequency distribution:
|
Class interval
|
Frequency
|
|
150-153
|
7
|
|
154-157
|
7
|
|
158-161
|
15
|
|
162-165
|
10
|
|
166-169
|
5
|
|
170-173
|
6
|
Answer:
Given classes are :150 - 153, 154 - 157, 158-161 and so on.
Consider any one class: 150-153
The lower limit of 154 -157 = 154
Upper limit of 150 - 153 = 153
Difference = 154 - 153 = 1
Half of the difference = 0.5
The new class interval formed = (150 - 0.5) - (153 + 0.5) = 149.5 - 153.5.
Similarly, for other classes as well. So we get:
|
Class interval
|
Frequency
|
|
149.5-153-5
|
7
|
|
153.5-157.5
|
7
|
|
157.5-161.5
|
15
|
|
161.5-165.5
|
10
|
|
165.5-169.5
|
5
|
|
169.5-173.5
|
6
|
Question:6
The expenditure of a family on different heads in a month is given below:
|
Head
|
Food
|
Education
|
Clothing
|
House Rent
|
Others
|
Savings
|
|
Expenditure (in Rs)
|
4000
|
2500
|
1000
|
3500
|
2500
|
1500
|
Answer:
Here, we will draw a bar graph to represent the expenditure of a family for different heads in a month as follows:
Question:7
|
Elementary education
|
240
|
|
Secondary Education
|
120
|
|
University Education
|
190
|
|
Teacher's Training
|
20
|
|
Social Education
|
10
|
|
Other Educational Programmes
|
115
|
|
Cultural programmes
|
25
|
|
Technical Education
|
125
|
Answer:
Expenditure on Education of a country during a five year period (2002-2006), in crores of rupees, is given below:|
Elementry education
|
240
|
|
Secondary Education
|
120
|
|
University Education
|
190
|
|
Teacher's Training
|
20
|
|
Social Education
|
10
|
|
Other Educational Programmes
|
115
|
|
Cultural programmes
|
25
|
|
Technical Education
|
125
|

Question:8
|
Letters
|
a
|
e
|
i
|
o
|
r
|
t
|
u
|
|
Frequency
|
75
|
125
|
80
|
70
|
80
|
95
|
75
|
Answer:
We will draw the graph with letters (a, e, i, o, r, t, u) as follows:
Question:9
If the mean of the following data is 20.2, find the value of p:
|
x
|
10
|
15
|
20
|
25
|
30
|
|
f
|
6
|
8
|
p
|
10
|
6
|
The frequency distribution table can be prepared as follows-
|
$x_{i}$
|
$f_{i}$
|
$x_{i}f_{i}$
|
|
10
|
6
|
60
|
|
15
|
8
|
120
|
|
20
|
p
|
20 p
|
|
25
|
10
|
250
|
|
30
|
6
|
180
|
|
|
$\sum f_{i}=30+p$
|
$\sum f_{i}x_{i}=610+20p$
|
$610+20p=606+20.2p$
$610-606=20.2p-20p$
$4=0.2 p$
$p=\frac{4}{0.2}=\frac{40}{2}=20$
Hence, the value of p is $20$
Question:10
Obtain the meaning of the following distribution:
|
Frequency
|
Variable
|
|
4
|
4
|
|
8
|
6
|
|
14
|
8
|
|
11
|
10
|
|
3
|
12
|
Answer :
$\left [ 8.05 \right ]$
The frequency distribution table can be prepared as follows-
|
$x_{i}$
|
$f_{i}$
|
$x_{i}f_{i}$
|
|
4
|
4
|
16
|
|
6
|
8
|
48
|
|
8
|
14
|
112
|
|
10
|
11
|
110
|
|
12
|
3
|
36
|
|
|
$\sum f_{i}=40$
|
$\sum x_{i}f_{i}=322$
|
$\bar{x}=\frac{\sum x_{i}f_{i}}{\sum f_{i}}=\frac{322}{40}=\frac{161}{20}=8.05$
Hence, the mean is 8.05
Question:11
Answer: 72.2A class consists of 50 students, out of which 30 are girls.
The mean marks of 30 girls =73
Total score of 30 girls
$= 73 \times 30 = 2190.$
Now, number of boys are
$50 - 30 = 20.$
The mean marks of 20 boys =71
Total score of boys
$= 71 \times 20 = 1420$
$\Rightarrow$Here, the total score of whole class = Total score of all girls + Total score of all boys
$= 2190 + 1420 = 3610.$
$\text{Mean of all students}=\frac{\text{Total marks of all students} }{\text {Total number of students}}$
$=\frac{3610}{50}=72.2$
Hence, the mean of the whole class is 72.2.
Question:12
Answer :$\left [ 80.94 \right ]$
$\text{Mean}=\frac{\text {sum of all observations}}{\text {No. of observations}}$
Mean of 50 observations was found to be 80.4 (Incorrect mean)
The incorrect sum of all the numbers = Incorrect mean $\times$ Total numbers
$=80.4 \times 50=4020$
It was discovered that 96 was misread as 69 at one place
Hence, the correct sum of all the numbers
$= 4020 - 69 + 96 = 4047$
So correct mean
$\frac{4047}{50}=80.94$
Hence, the correct mean is 80.94.
Question:13
Answer: 20Here, the observations are :
$6, 14, 15, 17, x + 1, 2x - 13, 30, 32, 34, 43$
To calculate the median, arrange the given data in ascending order and then find the middle term. This middle term is called the median.
The terms are already given in ascending order, so we have to find the middle term.
Number of terms, n=10(even)
$\text{So, Median = average of}\left ( \frac{n}{2} \right )^{th}$ $\text{ and}\left ( \frac{n}{2} +1\right )^{th}\text{term}$
$\Rightarrow$ Median =24 (given)
$\text{Median}=\frac{\left ( \frac{n}{2} \right )^{th}\text {observation}+\left ( \frac{n}{2}+1 \right )^{th}\text {observation}}{2}$
$24=\frac{\left ( \frac{10}{2} \right )^{th}\text {obs.}+\left ( \frac{10}{2}+1 \right )\text {obs.}}{2}$
$24=\frac{5^{th}\text {obs.}+6^{th}\text {obs.}}{2}$
$24=\frac{x+1+2x-13}{2}$
$\Rightarrow 2 \times 24=x+1+2x-13$
$\Rightarrow 48=3x-12$
$\Rightarrow 48+12=3x$
$\Rightarrow 60=3x$
$\Rightarrow x=20$
Hence, the correct answer is 20.
Question:14
The points scored by a basketball team in a series of matches are as follows:
$17, 2, 7, 27, 25, 5, 14, 18, 10, 24, 48, 10, 8, 7, 10, 28$
Find the median and mode for the data.
Solution. To calculate the median, arrange the given data in ascending order and then find the middle term. This middle term is called the median.
Here total elements, n = 16 (even)
The terms as arranged in ascending order:
$2, 5, 7, 7, 8, 10, 10, 10, 14, 17, 18, 24, 25, 27, 28, 48$
Number of observations = 16 (even number)
Now, using the formula of the median in case the number of terms is even.
$\Rightarrow$ $\text{Median}=\frac{\left ( \frac{n}{2} \right )^{th}\text {obs}+\left ( \frac{n}{2}+1 \right )^{th}\text {obs}}{2}$
$=\frac{\left ( \frac{16}{2} \right )^{th}\text {obs}+\left ( \frac{16}{2}+1 \right )^{th}\text {obs}}{2}$
$median=\frac{\left ( 8^{th}\text {obs.}+9^{th}obs. \right )}{2}$
$\Rightarrow \frac{10+14}{2}=\frac{24}{2}$
Median =12
The mode is the value that occurs the most number of times in a given set of values
Now mode is 10 because it is the most repeating number.
Hence, median = 12 and mode = 10.
Question:15
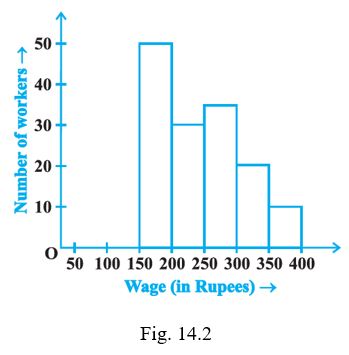
Answer:
Based on the given bar graph :|
Class-Interval
|
Frequency
|
|
150-200
|
50
|
|
200-250
|
30
|
|
250-300
|
35
|
|
300-350
|
20
|
|
350-400
|
10
|
|
Total workers
|
145
|
Question:16
|
Monthly income (in Rs)
|
Number of Televisions/household
| ||||
|
|
0
|
1
|
2
|
Above 2
| |
|
<10000
|
20
|
80
|
10
|
0
| |
|
10000-14999
|
10
|
240
|
60
|
0
| |
|
15000-19999
|
0
|
380
|
120
|
30
| |
|
20000-24999
|
0
|
520
|
370
|
80
| |
|
25000 and above
|
0
|
1100
|
760
|
220
| |
(i) of a household earning Rs 10000 – Rs 14999 per year and having exactly one television.
(ii) of a household earning Rs 25000 and more per year and owning 2 televisions.
(iii) of a household not having any television.
Answer:
Here, total events =4000(i) A household earning Rs 10000 – Rs 14999 per year and having exactly one television.
Favourable outcomes =240
$\text{Required probability}=\frac{240}{4000}=\frac{3}{50}$
(ii) A household earning Rs 25000 and more per year and owning 2 televisions.
Favourable outcomes =760
$\text{Required probability}=\frac{760}{4000}=0.19$
(iii) A household not having any television.
Favourable outcomes =20+10
$\text{Required probability}=\frac{30}{4000}=\frac{3}{400}$
Question:17
|
Sum
|
Frequency
|
|
2
|
14
|
|
3
|
30
|
|
4
|
42
|
|
5
|
55
|
|
6
|
72
|
|
7
|
75
|
|
8
|
70
|
|
9
|
53
|
|
10
|
46
|
|
11
|
28
|
|
12
|
15
|
(i) 3? (ii) more than 10?
(iii) less than or equal to 5? (iv) between 8 and 12?
Answer:
$\text{Probability }=\frac{\text {Favourable outcomes}}{\text {Total number of events}}$Here, total events = 14 + 30 + 42 + 55 + 72 + 75 + 70 + 53 + 46 + 28 +15 = 500
(i) probability of getting a sum = 3
Favourable events = 30
$\text{P[of getting sum 3]}=\frac{30}{500}=0.06$
(ii) probability of getting a sum more than 10
$\text{Favourable events}= 28 + 15 = 43$
$\text{P[of getting sum 10]}=\frac{43}{500}=0.086$
(iii) probability of getting a sum less than or equal to 5
Favourable events = 14 + 30 + 42 + 55
$\text{p[sum less than or equal to 5]}=\frac{141}{500}=\frac{28.2}{100}=2.282$
(iv) probability of getting a sum between 8 and 12
Favourable events = 53 + 46 + 28 = 127
$\text{p[sum between 8 and 12]}=\frac{127}{500}=0.254$
Question:18
Bulbs are packed in cartons, each containing 40 bulbs. Seven hundred cartons were examined for defective bulbs, and the results are given in the following table:
$
\begin{array}{|l|l|l|l|l|l|l|l|l|}
\hline \text {Number of defective bulbs} & 0 & 1 & 2 & 3 & 4 & 5 & 6 & \text {more than } 6 \\
\hline \text {Frequency} & 400 & 180 & 48 & 41 & 18 & 8 & 3 & 2 \\
\hline
\end{array}
$
One carton was selected at random. What is the probability that it has
(i) No defective bulb?
(ii) defective bulbs from 2 to 6?
(iii) defective bulbs less than 4?
Answer:
$\text{Probability is defined as }=\frac{\text {Favourable outcomes}}{\text {Total number of events}}$Here, total events = total cartons =700
(i) no defective bulb
Favourable outcomes =400
$\text{p (cartoon has no defective bulb) =}\frac{400}{700}=\frac{4}{7}$
(ii) defective bulbs from 2 to 6 = 2 or 3 or 4 or 5 or 6 defective bulbs
Favourable outcomes = 48 + 41 + 18 + 8 + 3 = 118
$\text{p(defective bulb from 2 to 6)}=\frac{118}{700}=\frac{59}{350}$
(iii) defective bulbs less than 4 = defective bulbs equal to 0 or 1 or 2 or 3
Favourable outcomes = 400 + 180 + 48 + 41 = 669
$\text{p(defective bulbs less than 4)}=\frac{669}{700}$
Question:19
|
Number of defective parts
|
0
|
1
|
2
|
3
|
4
|
5
|
6
|
7
|
8
|
9
|
10
|
11
|
12
|
13
|
|
Days
|
50
|
32
|
22
|
18
|
12
|
12
|
10
|
10
|
10
|
8
|
6
|
6
|
2
|
2
|
(i) no defective part
(ii) at least one defective part
(iii) Not more than 5 defective parts
(iv) more than 13 defective parts
Answer:
$\text{Probability is defined as}=\frac{\text {Favourable outcomes}}{\text {Total number of events}}$Here, total events = total number of working days =200
(i) no defective part
Favourable outcomes =50 days =50
$\text{p (no defective part)}=\frac{50}{200}=0.25$
(ii) Probability that at least one defective part = 1 - the probability that no defective part
$\text{p (no defective part)}=\frac{50}{200}=0.25$
$\text{p (at least one defective part)}=1-\frac{50}{200}=0.75$
(iii) Not more than 5 defective parts = 0 or 1 or 2 or 3 or 4 or 5 defective parts
p(not more than 5 defective parts) = p(no. defective part) + p(1 defective part) + p(2 defective part) + p(3 defective part) + p(4 defective part) + p(5 defective part)
$=\frac{50}{200}+\frac{32}{200}+\frac{22}{200}+\frac{18}{200}+\frac{12}{200}+\frac{12}{200}$
$=\frac{50+32+22+18+12+12}{200}=\frac{146}{200}$
$=\frac{73}{200}=0.73$
(iv) more than 13 defective parts = not possible
Favourable outcomes = 0
p (more than 13 defective parts) = 0
Question:20
A recent survey found that the ages of workers in a factory are distributed as follows:
|
Age (in years)
|
20-29
|
30-39
|
40-49
|
50-59
|
60 and above
|
|
Number of workers
|
38
|
27
|
86
|
46
|
3
|
(i) 40 years or more
(ii) under 40 years
(iii) having age from 30 to 39 years
(iv) under 60 but over 39 years
Answer:
$\text{Probability}=\frac{\text {Favourable outcomes}}{\text {Total number of events}}$Here, total events = total number of workers= 38 + 27 + 86 + 46 + 3 = 200
(i) p (person is 40 years or more) = p(person having age 40 to 49 years) + p (person having age 50 to 59 years) + p (having age 60 and above)
$=\frac{86}{200}+\frac{46}{200}+\frac{3}{200}=\frac{135}{200}=0.675$
(ii) p(person is under 40 years) = p(person having age 20 to 29 years) + p(person having age 30 to 39 years)
$=\frac{38}{200}+\frac{27}{200}=\frac{65}{200}=0.325$
Hence, the different age groups decided on the work.
$\text{(iii) p(having age from 30 to 39 years) }=\frac{27}{200}=0.135$
(iv) p(under 60 but over 39 years) = p(person having age 40 to 49 years) + p (person having age 50 to 59 years)
$=\frac{86}{200}+\frac{46}{200}=\frac{132}{200}=0.66$
| Exercise: 14.4 Total Questions: 12 Page number: 147-149 |
Question:1
The following are the marks (out of 100) of 60 students in mathematics.
$16, 13, 5, 80, 86, 7, 51, 48, 24, 56, 70, 19, 61, 17, 16, 36,$
$ 34, 42, 34, 35, 72,55, 75, 31, 52, 28,72, 97, 74, 45, 62, 68, $
$86, 35, 85, 36, 81, 75, 55, 26, 95, 31, 7, 78,92, 62, 52, 56, 15,$
$ 63,25, 36, 54, 44, 47, 27, 72, 17, 4, 30.$
Construct a grouped frequency distribution table with width 10 of each class starting from 0 - 9.
Answer:
Step 1: Arrange these numbers in ascending order.
$\\4, 5, 9, 7, 13, 15, 16, 17, 17, 19,$
$ 24, 25, 26, 27, 28, 30, 31, 34, 34, 34, 35, 35, 36, 36, 36,$
$ 42, 44, 45, 47, 48, 51, 52, 52, 54, 55, 55, 56, 56,$
$61, 62, 62, 63, 68, 70, 72, 72, 72, 74, 75, 75, 78,$
$80, 81, 85, 86, 92, 95, 97.$
Step 2: Make the frequency distribution table as follows:
The class interval of (0-9), (10-19), etc., are given.
So, we can write the class interval and the corresponding frequency.
|
Class interval
|
Frequency
|
|
0-9
|
4
|
|
10-19
|
7
|
|
20-29
|
5
|
|
30-39
|
10
|
|
40-49
|
5
|
|
50-59
|
8
|
|
60-69
|
5
|
|
70-79
|
8
|
|
80-89
|
5
|
|
90-99
|
3
|
|
Total
|
60
|
Question:2
The following are the marks (out of 100) of 60 students in mathematics.
$16, 13, 5, 80, 86, 7, 51, 48, 24, 56, 70, 19, 61, 17, 16,$
$ 36, 34, 42, 34, 35, 72, 55,75, 31, 52, 28,72, 97, 74,$
$ 45, 62, 68, 86, 35, 85, 36, 81, 75, 55, 26, 95, 31, 7, 78,$
$92, 62, 52, 56, 15, 63,25, 36, 54, 44, 47, 27, 72, 17, 4, 30.$
Construct a grouped frequency distribution table with width 10 of each class, in such a way that one of the classes is 10 - 20 (20 not included).
Answer:
Step 1: Arrange these numbers in ascending order.$4, 5, 9, 7, 13, 15, 16, 17, 17, 19,$
$24, 25, 26, 27, 28, 30, 31, 34, 34, 34, 35, 35, 36, 36, 36,$
$42, 44, 45, 47, 48, 51, 52, 52, 54, 55, 55, 56, 56,$
$61, 62, 62, 63, 68, 70, 72, 72, 72, 74, 75, 75, 78,$
$80, 81, 85, 86, 92, 95, 97.$
Step 2: Make the frequency distribution table as follows:
The class interval of (0-10), (10-20), etc., are given.
So, we can write the class interval and the corresponding frequency.
A value like 10 will always be counted in the interval where it is the lower limit, i.e., 10-20 and not in 0-10 (where it is the higher limit)
|
Class interval
|
Frequency
|
|
0-10
|
4
|
|
10-20
|
7
|
|
20-30
|
5
|
|
30-40
|
10
|
|
40-50
|
5
|
|
50-60
|
8
|
|
60-70
|
5
|
|
70-80
|
8
|
|
80-90
|
5
|
|
90-100
|
3
|
|
Total
|
60
|
Question:3
Draw a histogram of the following distribution :
|
Heights (in cm)
|
Number of students
|
|
150-153
|
7
|
|
153-156
|
8
|
|
156-159
|
14
|
|
159-162
|
10
|
|
162-165
|
6
|
|
165-168
|
5
|
Answer:
To draw the histogram, we have to plot the frequency, i.e., number of students on the y-axis and class interval, i.e., heights on the x-axis. We can construct the histogram as follows:
Question:4
Draw a histogram to represent the following grouped frequency distribution :
|
Ages (in years)
|
Number of teachers
|
|
20-24
|
10
|
|
25-29
|
28
|
|
30-34
|
32
|
|
35-39
|
48
|
|
40-44
|
50
|
|
45-49
|
35
|
|
50-54
|
12
|
Answer:
We can see that the intervals are 20-24, 25-29, 30-34....etcFor the interval 20-24: Upper limit is 24
For the interval 25-29: Lower limit is 25
Difference = 25 - 24 = 1
$\frac{1}{2}\left ( \text {upper limit-lower limit} \right )=\frac{1}{2}\left ( 1 \right )=0.5$
Now, we will subtract 0.5 from all lower limits & add 0.5 to all upper limits
|
Ages
|
No. of teachers
|
|
19.5-24.5
|
10
|
|
24.5-29.5
|
28
|
|
29.5-34.5
|
32
|
|
34.5-39.5
|
48
|
|
39.5-44.5
|
50
|
|
44.5-49.5
|
35
|
|
49.5-54.5
|
12
|
Question:5
|
Length (in mm)
|
Number of leaves
|
|
118-126
|
8
|
|
127-135
|
10
|
|
136-144
|
12
|
|
145-153
|
17
|
|
154-162
|
7
|
|
163-171
|
5
|
|
172-180
|
3
|
Answer:
We can see that the intervals are 118-126, 127-135, 136-144...etcFor the interval 118-126: Upper limit is 126
For the interval 127-135: Lower limit is 127
Difference = 127 - 126 = 1
$\frac{1}{2}\left ( \text {upper limit - lower limit} \right )=\frac{1}{2}\left ( 1 \right )=0.5$
Now, we will subtract 0.5 from all lower limits & add 0.5 to all upper limits
|
Length (in mm)
|
Number of leaves
|
|
117.5-126.5
|
8
|
|
126.5-135.5
|
10
|
|
135.5-144.5
|
12
|
|
144.5-153.5
|
17
|
|
153.5-162.5
|
7
|
|
162.5-171.5
|
5
|
|
171.5-180.5
|
3
|

Question:6
The marks obtained (out of 100) by a class of 80 students are given below :
|
Marks
|
Number of students
|
|
10-20
|
6
|
|
20-30
|
17
|
|
30-50
|
15
|
|
50-70
|
16
|
|
70-100
|
26
|
Answer:
To draw the histogram, we have to plot the frequency, i.e., number of students on the y-axis and class interval, i.e., marks on the x-axis. We can construct the histogram as follows:
Question:7
|
Class interval (km/h)
|
Frequency
|
|
30-40
|
3
|
|
40-50
|
6
|
|
50-60
|
25
|
|
60-70
|
65
|
|
70-80
|
50
|
|
80-90
|
28
|
|
90-100
|
14
|
Answer:
To draw the histogram, we have to plot the frequency on the y-axis and the class interval on the x-axis. We can construct the histogram as follows:
A frequency polygon is a graph constructed by using lines to join the midpoints of each interval.
Accordingly, the curve ABCDEFGHI is the frequency polygon.
Question:8
|
Class interval (km/h)
|
Frequency
|
|
30-40
|
3
|
|
40-50
|
6
|
|
50-60
|
25
|
|
60-70
|
65
|
|
70-80
|
50
|
|
80-90
|
28
|
|
90-100
|
14
|
Answer:
A frequency polygon is a graph constructed by using lines to join the midpoints of each interval.Here we the midpoints as follows:
Class interval Mid-point Frequency
30 - 40 35 3
40 - 50 45 6
50 - 60 55 25
60 - 70 65 65
70 - 80 75 50
80 - 90 85 28
90 – 100 95 14
Hence, we can construct the points using the mid-point on the x-axis and the corresponding frequency on the y-axis.
So the frequency polygon will be as follows:

Question:9
|
Section A
|
Section B
| ||
|
Marks
|
Frequency
|
Marks
|
Frequency
|
|
0-15
|
5
|
0-15
|
3
|
|
15-30
|
12
|
15-30
|
16
|
|
30-45
|
28
|
30-45
|
25
|
|
45-60
|
30
|
45-60
|
27
|
|
60-75
|
35
|
60-75
|
40
|
|
75-90
|
13
|
75-90
|
10
|
Answer:
$\text{Formula of to find the class marks }$$=\frac{\text {upper class limit}+\text {lower class limit}}{2}$
|
Marks
|
Class marks
|
Frequency A
|
Frequency B
|
|
0-15
|
$0+15=\frac{15}{2}=7.5$
|
5
|
3
|
|
15-30
|
$\frac{15+30}{2}=\frac{45}{2}=22.5$
|
12
|
16
|
|
30-45
|
$\frac{30+45}{2}=\frac{75}{2}=37.5$
|
28
|
25
|
|
45-60
|
$52.5$
|
30
|
27
|
|
60-75
|
$67.5$
|
35
|
40
|
|
75-90
|
$82.5$
|
13
|
10
|
Points where frequency is zero:
Difference $= 22.5 - 7.5 = 15$
First Point $=7.5-15 = -7.5$
Last point $=82.5+7.5= 90$
So, we can construct the frequency polygon of A (orange) and B (blue) as follows:

Question:10
The mean of the following distribution is 50.
Find the value of a and hence the frequencies of 30 and 70.Answer:
$a = 5, f_{30} = 28, f_{70} = 24$The frequency distribution table is as follows:
|
$x_{i}$
|
$f_{i}$
|
$f_{i}x_{i}$
|
|
10
|
17
|
170
|
|
30
|
$5a+3$
|
$150a+90$
|
|
50
|
32
|
1600
|
|
70
|
$7a-11$
|
$490a-770$
|
|
90
|
19
|
$1710$
|
|
Total
|
$60+12a$
|
$2800+640a$
|
$\frac{50}{1}=\frac{2800+640a}{60+12a}$
[Cross multiply]
$50\left ( 60+12a \right )=2800+640\; a$
$3000+600a=2800+640a$
$3000 - 2800 = 640a - 600a$
$200 = 40a$
$\frac{200}{40}=a$
$a=5$
$\\f_{30} = 5a + 3 $
$ f_{30} = 5(5) + 3 = 28$
$ f_{70} = 7a - 11$
$ f_{70} = 7(5) -11$
$ f_{70} = 35 - 11 = 24$
Question:10
The mean of the following distribution is 50.
|
x
|
f
|
|
10
|
$17$
|
|
30
|
$5a+3$
|
|
50
|
$32$
|
|
70
|
$7a-11$
|
|
90
|
$19$
|
Answer:
$a = 5, f_{30} = 28, f_{70} = 24$The frequency distribution table is as follows:
|
$x_{i}$
|
$f_{i}$
|
$f_{i}x_{i}$
|
|
10
|
17
|
170
|
|
30
|
$5a+3$
|
$150a+90$
|
|
50
|
32
|
1600
|
|
70
|
$7a-11$
|
$490a-770$
|
|
90
|
19
|
$1710$
|
|
Total
|
$60+12a$
|
$2800+640a$
|
$\frac{50}{1}=\frac{2800+640a}{60+12a}$
[Cross multiply]
$50\left ( 60+12a \right )=2800+640\; a$
$3000+600a=2800+640a$
$3000 - 2800 = 640a - 600a$
$200 = 40a$
$\frac{200}{40}=a$
$a=5$
$\\f_{30} = 5a + 3 $
$f_{30} = 5(5) + 3 = 28$
$ f_{70} = 7a - 11$
$ f_{70} = 7(5) -11$
$ f_{70} = 35 - 11 = 24$
Question:11
Answer : [ 2:1 ]Let the no. of boys and girls be x and y respectively.
$\text{ Mean }=\frac{\text { sum of observations}}{\text {Number of observations}}$
Now, the mean marks of x boys in the examination =70
Sum of marks of x boys =70 x
Mean marks of y girls in the examination =73
Sum of marks of y girls =73y
Given, mean marks of all students (x + y) = 71
Sum of marks of all students (x + y) = 71(x + y)
Now, sum of marks of all students x + y = sum of marks of x boys and sum of marks of y girls
$\\71(x + y) = 70x + 73 y$
$ 71x + 71y = 70x + 73y$
$ 71x - 70x = 73y- 71y$
$x = 2y$
$\frac{x}{y}=\frac{2}{1}$
Hence, the ratio is x:y=2:1
Question:12
Answer:
Answer: The mean is 75.88, mode is 85, median is 77Arrange the data in ascending order
$54, 65, 67, 68, 68, 69, 70, 71, 73, 73, 75, 76, 77, 77, 78, 78, 80,$
$81, 81, 83, 85, 85, 85, 85, 87$
$\text {Mean}=\frac{\text {sum of all obseravations}}{\text {Total number of observations}}$
$=\frac{1891}{25}=75.88$
The mean is 75.88
Mode is the value that occurs the most number of times in a given set of values
So, 85 is the mode, and its frequency is 4 times.
To calculate the median, arrange the given data in ascending order and then find the middle term. This middle term is called the median.
The data in ascending order is:
$54, 65, 67, 68, 68, 69, 70, 71, 73, 73, 75, 76, 77, 77, 78, 78, 80,$
$81, 81, 83, 85, 85, 85, 85, 87$
Number of terms, n=25
$\left ( \frac{n+1}{2} \right )^{th}\text{ term is the median}$
$=\left ( \frac{25+1}{2} \right )^{th}\text{ term}$$=\left ( \frac{26}{2} \right )^{th}\text{ term}$
13th term is 77
Hence, the median is 77.
NCERT Class 9 Exemplar Solutions for Other Subjects
Students can also check the NCERT Exemplar solutions of other subjects using the following links.
NCERT Exemplar Class 9 Maths Solutions Chapter-Wise
Careers360 makes it easy by providing all NCERT Class 9 Maths Exemplar Solutions in a single place. Use the links below to check them out.
Confused between CGPA and Percentage?
Get your results instantly with our calculator!
Importance of NCERT Exemplar Solutions Class 9 Maths Chapter 14
Class 9 Maths NCERT exemplar solutions chapter 14 Statistics and Probability provides adequate practice and information on this chapter in a student-friendly process flow that can be further applied in higher classes as well as in exams like NTSE, JEE, Olympiads, etc. Here are some more points on why students should check these solutions.
- These solutions are prepared by following the latest CBSE guidelines and patterns so that students can be ready accordingly.
- Every problem has been explained in simple language, keeping in mind each type of student. Also, alternative solutions and important formulae have been provided with it.
- This chapter will also strengthen the concepts of data handling and chance-related problems.
- Practising these advanced-level problems will also make it easier for students to solve the NCERT exercises.
- Consistent practice of these Exemplar problems will help students improve their accuracy and time management skills.
NCERT Solutions for Class 9 Mathematics: Chapter-wise
All NCERT Class 9 Maths Solutions are gathered together on Careers360 for quick access. Click the links below to view them.
NCERT Solutions Subject Wise
NCERT textbook solutions of other subjects have also been provided in the links below.
NCERT Notes Subject Wise
Notes can be used during revision time to recall important concepts and formulas. The following links will lead students to well-structured notes that they can use to achieve excellence.
NCERT Books and NCERT Syllabus
Before the start of a new academic year, students should refer to the latest syllabus to determine the chapters they’ll be studying. Below are the updated syllabus links, along with some recommended reference books.
Frequently Asked Questions (FAQs)
No, the possibility of occurring or not occurring may have different methods. Therefore, we can say occurring or non-occurring are not equally likely. If two events are not equally likely their probability will not be the same.
Mean, median, and mode of any data represent the central tendency of the data.
Mode represents the most favourable data outcome.
Mean represent the average value of the data.
Median represents the middle value, if the data is arranged in decreasing or increasing order.
When the occurrence of any event cannot be denied, the event is called a sure event. For example, the sun will rise in the east can be seen as a sure event. The probability of a sure event is one.
The probability of any event cannot be more than one. The maximum probability is 1 for sure events. The minimum probability is 0 for impossible events
On the basis of analysis of large data, we estimate the occurrence of any event this analysis is called statistical probability. Most of the recent scientific researches are based on statistical probability
The chapter on Statistics and Probability is a very important chapter from the exam’s perspective as it accounts for 10-12% marks of the final paper. NCERT exemplar Class 9 Maths solutions chapter 14 provides sufficient learning content to the students to develop a better understanding and score well in the exam.

Popular Questions
A block of mass 0.50 kg is moving with a speed of 2.00 ms-1 on a smooth surface. It strikes another mass of 1.00 kg and then they move together as a single body. The energy loss during the collision is
| Option 1)
|
Option 2)
|
| Option 3)
|
Option 4)
|
An athlete in the olympic games covers a distance of 100 m in 10 s. His kinetic energy can be estimated to be in the range
| Option 1)
|
Option 2)
|
| Option 3)
|
Option 4)
|
A particle is projected at 600 to the horizontal with a kinetic energy . The kinetic energy at the highest point
| Option 1)
|
Option 2)
|
| Option 3)
|
Option 4)
|
In the reaction,
| Option 1)
|
Option 2)
|
| Option 3)
|
Option 4)
|
How many moles of magnesium phosphate, will contain 0.25 mole of oxygen atoms?
| Option 1)
0.02 |
Option 2)
3.125 × 10⁻² |
| Option 3)
1.25 × 10⁻² |
Option 4)
2.5 × 10⁻² |