

NCERT Solutions for Class 9 Maths Chapter 7 - The Mathematics of Maybe: Introduction to Probability
Have you ever wondered why getting a six on a dice feels lucky when all numbers have an equal chance of showing up? Every day we face situations where we are not sure of the result. Probability is a branch of mathematics that helps us to measure and understand these chances. From weather forecasts to cricket matches probability helps us make sense of uncertain events. These NCERT Solutions for Class 9 Mathematics Chapter 7 The Mathematics of Maybe: Introduction to Probability introduces students to a new chapter altogether which they will learn for the first time in Class 9. The importance of building a strong foundation of these Probability concepts is very helpful for higher studies as well as competitive examinations. These NCERT Solutions for Class 9 can be an essential study resource for students.
This Story also Contains
- The Mathematics of Maybe: Introduction to Probability Class 9 Questions and Answers PDF Free Download
- NCERT Solutions for Class 9 Maths Chapter 7 The Mathematics of Maybe: Introduction to Probability: Exercise Questions
- The Mathematics of Maybe: Introduction to Probability Class 9 Chapter 7: Topics
- Class 9 Maths NCERT Chapter 7 Solutions: Extra Questions
- NCERT Solutions for Class 9 Maths Chapter Wise
- NCERT Class 9 Books & Syllabus
Probability is the bridge between uncertainty and mathematical reasoning. Careers360 experts with multiple years of experience have prepared these solutions in a simple manner so that every type of student can understand them. These NCERT Solutions for Class 9 Maths are step by step explained with diagrams wherever necessary. These NCERT solutions can be used by students if they want to practice the chapters independently.
The Mathematics of Maybe: Introduction to Probability Class 9 Questions and Answers PDF Free Download
Students can download the Class 9 Maths Chapter 7 The Mathematics of Maybe: Introduction to Probability PDF by clicking the link provided below.
NCERT Solutions for Class 9 Maths Chapter 7 The Mathematics of Maybe: Introduction to Probability: Exercise Questions
Here are the NCERT Class 9 Maths Chapter 7 The Mathematics of Maybe: Introduction to Probability question answers with clear and detailed solutions.
Think and Reflect (Page 156)
Question: Such unpredictability can be useful sometimes! For example, in a cricket
match, the fact that a coin is tossed to decide which team will bat first is
considered to be a fair method. Can you explain why?
$\textbf{Answer:}$
The coin toss in a cricket match is considered fair because neither team can control or predict the outcome of the toss.
For a fair coin, there are two possible outcomes: Heads and Tails
Each outcome is equally likely.
Probability of getting a Head $=\frac12$
Probability of getting a Tail $=\frac12$
The Mathematics of Maybe: Introduction to Probability Class 9 Questions and AnswersExercise Set 7.1 |
Question 1: Rank the following events on a scale from 0 (Impossible) to 1 (Certain). Label each event: Impossible, less likely, equally likely (even chance), more likely, certain. Give reasons why you gave each event its ranking.
(i) The next Monday will come after Sunday.
(ii) It will snow in Mumbai in July.
(iii) An elephant will walk through your classroom today.
(iv) You will greet at least one friend at school tomorrow.
$\textbf{Answer:}$
Let the labels be
- Impossible: Probability = 0
- Less likely: Probability between 0 and 0.5
- Equally likely (even chance): Probability = 0.5
- More likely: Probability between 0.5 and 1
- Certain: Probability = 1
(i) The next Monday will come after Sunday.
In the standard calendar system, the sequence of days of the week is fixed and repeating, where Monday always immediately succeeds Sunday.
So, it is a certain event with probability 1.
(ii) It will snow in Mumbai in July.
Mumbai has a tropical climate, and its temperatures in July remain warm (typically above 25°C) alongside heavy monsoon rainfall, making snowfall meteorologically impossible.
So, it is an impossible event with probability 0.
(iii) An elephant will walk through your classroom today.
Elephants are wild or domesticated animals kept in specific habitats like forests, zoos, or sanctuaries, and they do not roam freely inside standard school buildings or city classrooms. But it can be possible under extreme circumstances.
So, it is a less likely event with a probability of 0.1.
(iv) You will greet at least one friend at school tomorrow.
If you attend school and have friends there, greeting at least one friend is quite likely, though not absolutely certain.
So, it is a more likely event with a probability of 0.9.
The Mathematics of Maybe: Introduction to Probability Class 9 Questions and AnswersExercise Set 7.2 |
Question 1. A teacher mixes a large bag of sweets of different colours and randomly selects a sample of 30 sweets. She counts the number of sweets of each colour:
10 red sweets | 8 green sweets | 7 yellow sweets | 5 blue sweets
(i) Calculate the probability that a randomly picked sweet from the sample is green.
(ii) If there are 600 sweets in total in the large bag, estimate how many are likely to be yellow, based on the sample results.
$\textbf{Answer:}$
(i)
Probability that a randomly picked sweet is green
$=\frac{\text { Number of green sweets }}{\text { Total sweets in sample }}$
$=\frac{8}{10+8+7+5}=\frac{8}{30}=\frac{4}{15}$
(ii)
Probability that a randomly picked sweet is yellow from a sample of 30 sweets is:
$\frac{7}{30}$
So, the estimated number of yellow sweets among 600 sweets
= $\frac{7}{30}\times600=140$
Question 2. A survey is conducted at a school where a random sample of 40 students is asked about their favourite club. The responses are:
14 students: Science Club | 11 students: Arts Club |
9 students: Sports Club | 6 students: Debate Club
Assume there are 800 students in the whole school.
(i) What is the probability that a randomly chosen student from the sample prefers the Arts Club?
(ii) Using the sample results, estimate how many students in the whole school are likely to prefer the Sports Club.
$\textbf{Answer:}$
(i)
Probability that a student prefers the Arts Club
$=\frac{\text { Number of Art's club students }}{\text { Total number of students in sample }}$
$=\frac{11}{14+11+9+6}=\frac{11}{40}$
(ii)
Probability that a student prefers the Sports Club
$=\frac{\text { Number of Sports club students }}{\text { Total number of students in sample }}$
$=\frac{9}{14+11+9+6}=\frac{9}{40}$
So, the estimated number in a school of 800 students
$=\frac{9}{40}\times800=180$
Question 3. Toss a coin 20 times and record the result each time (heads or tails).
(i) How many times did you get heads?
(ii) How many times did you get tails?
(iii) Calculate the experimental probability of getting heads.
(iv) If you toss the coin once more, what is the probability of getting tails?
$\textbf{Answer:}$
(i) Out of 20 coin tosses, let us assume we get heads 10 times.
(ii) Out of 20 coin tosses, let us assume we get tails 10 times.
(iii) Probability of getting heads
$=\frac{\text { Number of heads }}{\text { Total tosses }}$
$=\frac{10}{20}=\frac12$
(iv)
For a fair coin, each toss is independent.
Therefore, Probability of getting tails on one more toss $=\frac12$
Question 4. Toss a paper cup into the air 100 times. After each toss record whether the cup lands on its bottom, upside down on its top or on its side (See Fig. 7.5). Assign probabilities to the outcomes by using experimental probability.
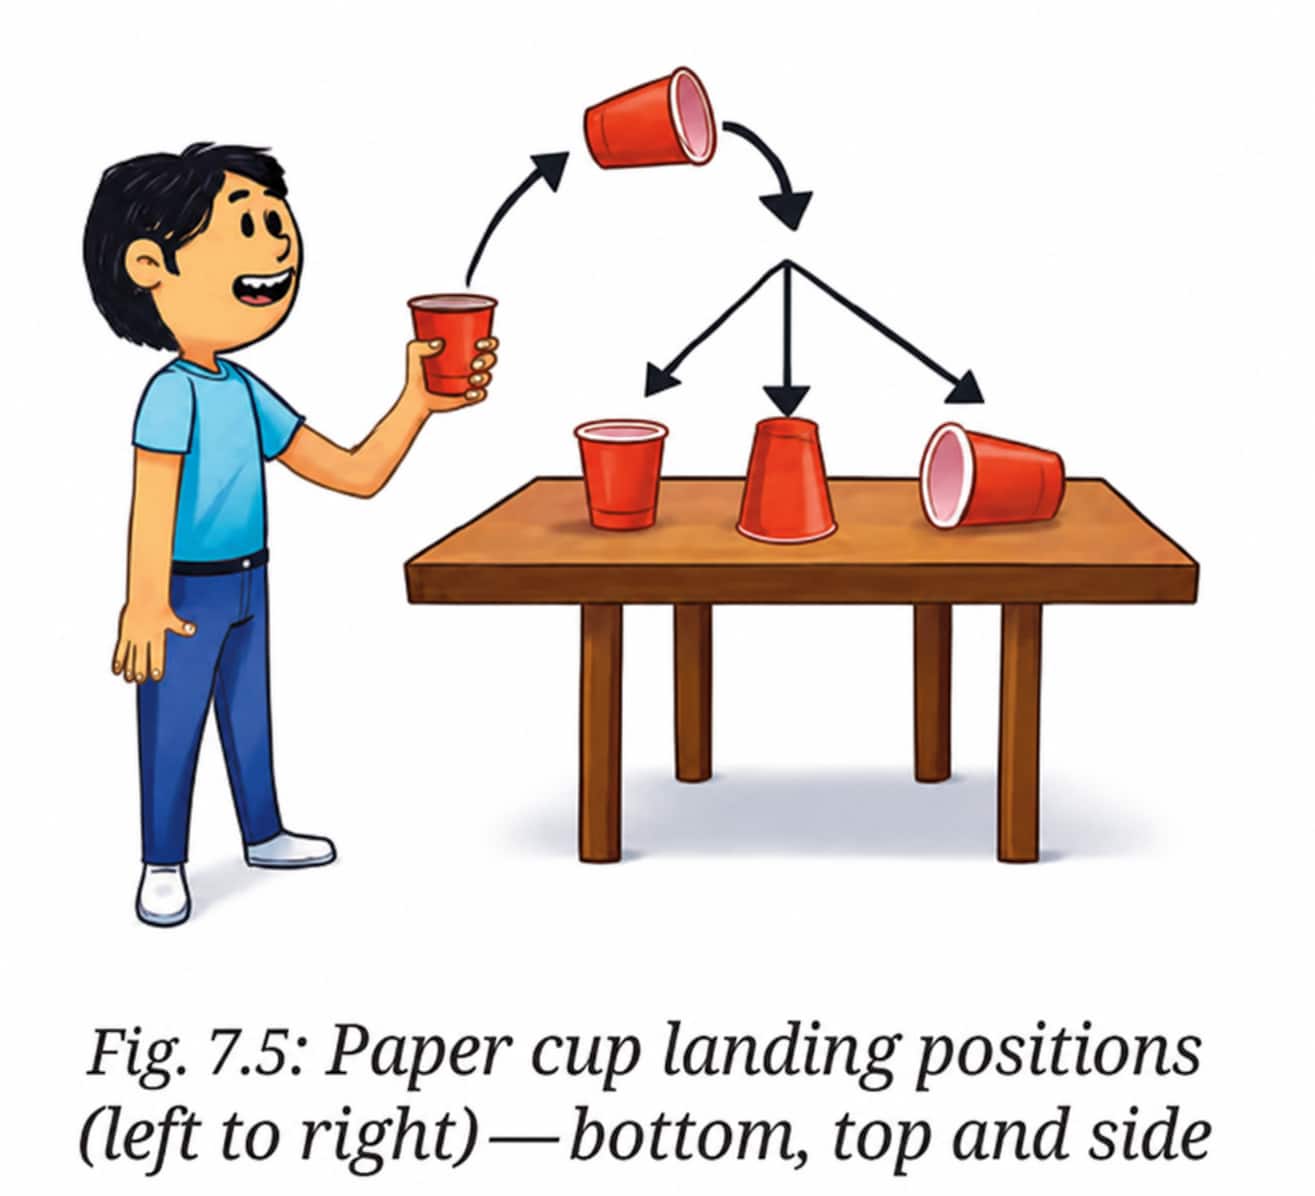
$\textbf{Answer:}$
Let us record a highly realistic set of outcomes from 100 manual tosses:
Lands on its side: 70 times
Lands upright on its bottom: 20 times
Lands upside down on its top: 10 times
Total number of trials = 100
The experimental probability for an event is given by:
$\text {Experimental Probability }=\frac{\text { Number of times the event occurs }}{\text { Total number of trials }}$
So, Probability of landing on its side $=\frac{70}{100}=\frac7{10}$
Probability of landing on its bottom $=\frac{20}{100}=\frac15$
Probability of landing on its top $=\frac{10}{100}=\frac1{10}$
Question 5. What is the probability of getting an even number when rolling a fair 6-sided die?
$\textbf{Answer:}$
A standard fair 6-sided die has a total of 6 possible outcomes when rolled, which are the numbers 1, 2, 3, 4, 5, and 6.
The even numbers in this sample space are 2, 4, and 6, which gives a total of 3 favourable outcomes.
Hence, the probability of getting an even number
$=\frac{\text{Number of favourable outcomes}}{\text{Number of possible outcomes}}=\frac36=\frac12$
Question 6. Suppose you roll a 6 -sided die 12 times and get a ' 3 ' three times.
(i) What is the experimental probability of rolling a ' 3 '?
(ii) What is the theoretical probability of rolling a ' 3 '?
(iii) Why might these probabilities be different? What would you expect to happen if you roll the die 60,600, or 6000 times?
$\textbf{Answer:}$
(i)
Experimental probability of rolling a '3'
$=\frac{\text { Number of times '3' occurred }}{\text { Total number of rolls }}=\frac3{12}=\frac14$
(ii)
A fair die has 6 equally likely outcomes, and only one of them is '3'.
So, theoretical probability of rolling a ' 3 ' $=\frac16$
(iii)
The experimental probability is based on actual results, while the theoretical probability is based on all possible outcomes assuming the die is fair.
With only 12 rolls, chance variations can cause the experimental probability to differ from the theoretical probability.
As the number of rolls increases (60,600, or 6000 rolls), the experimental probability is expected to get closer and closer to the theoretical probability of $\frac{1}{6}$.
This is because larger samples tend to give more reliable results.
The Mathematics of Maybe: Introduction to Probability Class 9 Questions and AnswersExercise Set 7.3 |
Question 1. When a single 6 -sided die is rolled, what is the total number of possible outcomes in the sample space?
$\textbf{Answer:}$
When a single 6-sided die is rolled, the possible outcomes are: 1, 2, 3, 4, 5, and 6
Therefore, the total number of possible outcomes in the sample space is 6.
Question 2. For the following experiments write down the sample space S.
(i) Rolling a die and tossing a coin together.
(ii) Choosing a random integer between -5 and +5.
(iii) A box containing 5 green and 7 red balls. One ball is drawn at random.
$\textbf{Answer:}$
(i)
In a fair coin, outcomes are Heads, denoted by H and tails, denoted by T.
In a fair die, possible outcomes are: 1, 2, 3, 4, 5, and 6
So, if we roll a die and toss a coin together, the sample space, S
= {(1, H), (2, H), (3, H), (4, H),(5, H), (6, H), (1, T), (2, T), (3, T), (4, T),(5, T), (6, T)}
(ii)
If we choose a random integer between -5 and +5, the sample space, S
= {-5,-4,-3,-2,-1,0,1,2,3,4,5}
(iii)
Since the outcome depends only on the colour of the ball drawn, the sample space, S = {Green, Red}
Question 3. In a village fair, there are 3 popular snacks available:
Samosa, Pakora, and Bhaji.
For drinks, villagers can choose either Chai or Lassi.
(i) List the sample space of all possible snack and drink combinations a person could choose at the fair.
(ii) List the event 'Selecting Samosa as a snack.'
$\textbf{Answer:}$
Snack options: Samosa, Pakora, and Bhaji
Drink options: Chai, Lassi
(i)
So, the sample space of all possible snack and drink combinations, S
= {(Samosa, Chai), (Samosa, Lassi), (Pakora, Chai), (Pakora, Lassi), (Bhaji, Chai), (Bhaji, Lassi)}
(ii)
All outcomes where the snack chosen is a Samosa are:
{(Samosa, Chai), (Samosa, Lassi)}
The Mathematics of Maybe: Introduction to Probability Class 9 Questions and AnswersExercise Set 7.4 |
Question 1: There are two fruit baskets A and B. Basket A has one apple and two oranges. Basket B has one banana and one mango. You randomly pick one fruit from each basket.
(i) Draw a tree diagram showing all possible pairs of fruits.
(ii) List the sample space.
(iii) What is the probability of picking one apple and one banana?
$\textbf{Answer:}$
(i)
Let's denote Apple by A, Banana by B, Orange by O, and Mango by M.
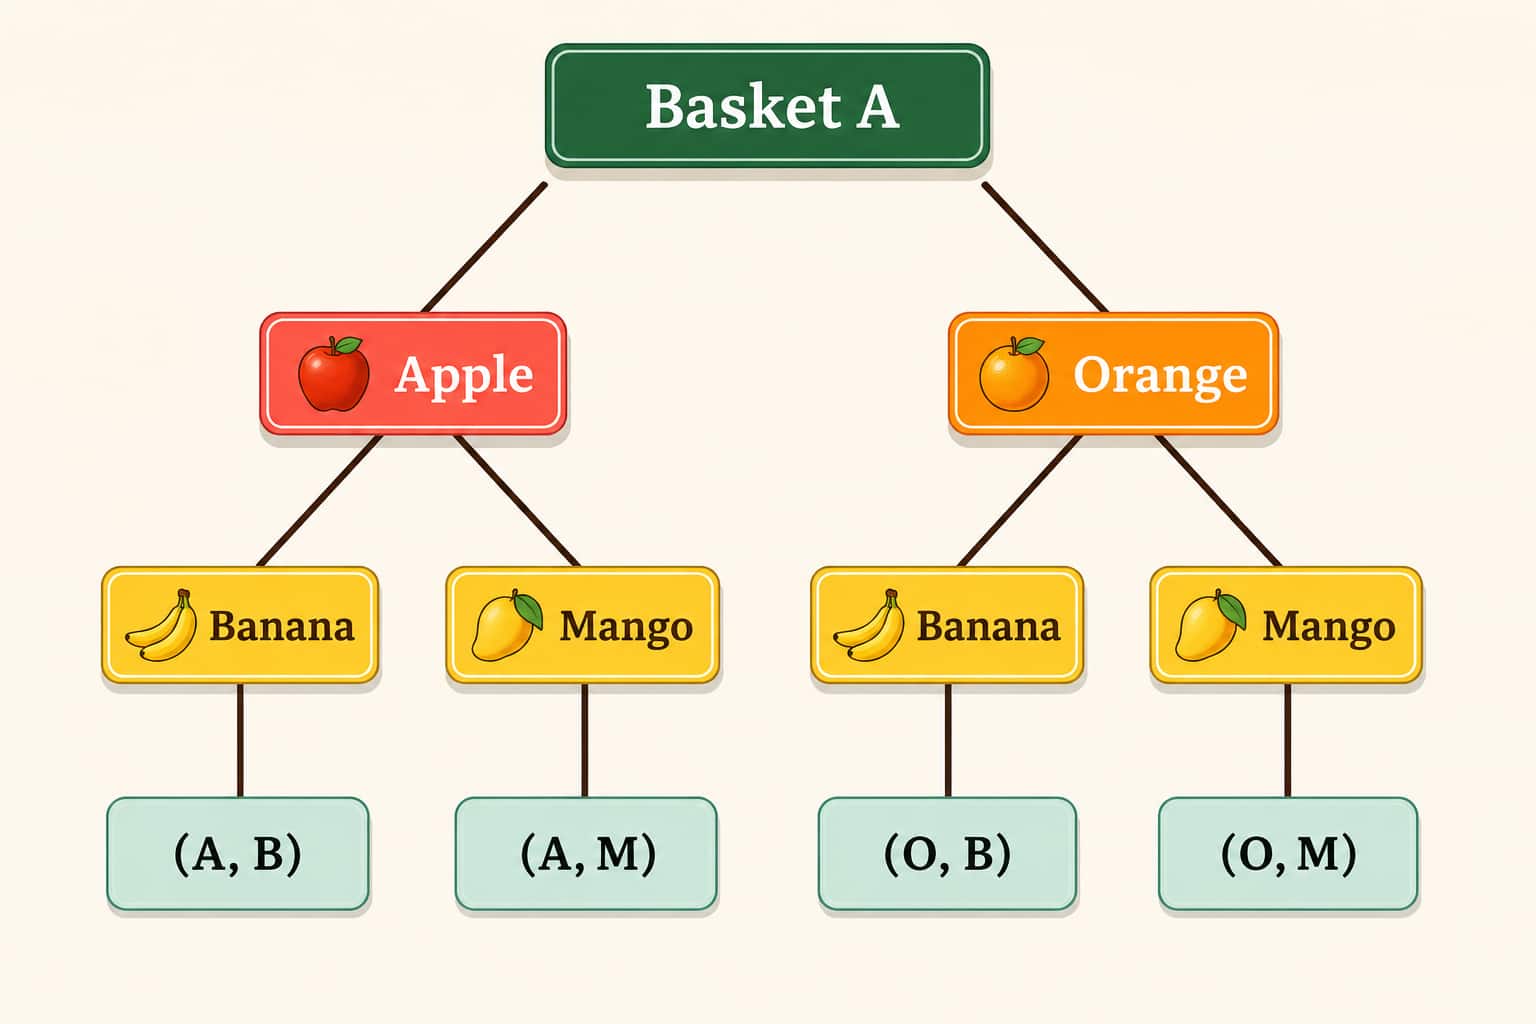
(ii)
Sample space, S = {(A, B), (A, M), (O, B), (O, M}
Or,
S = {(Apple, Banana), (Apple, Mango), (Orange, Banana), (Orange, Mango)}
(iii)
Basket A contains 3 fruits, of which 1 is an apple.
So, the probability of picking an apple $=\frac13$
Basket B contains 2 fruits, of which 1 is a banana.
So, the probability of picking a banana $=\frac12$
Therefore, the probability of picking One Apple and One Banana together
$=\frac13\times\frac12=\frac16$
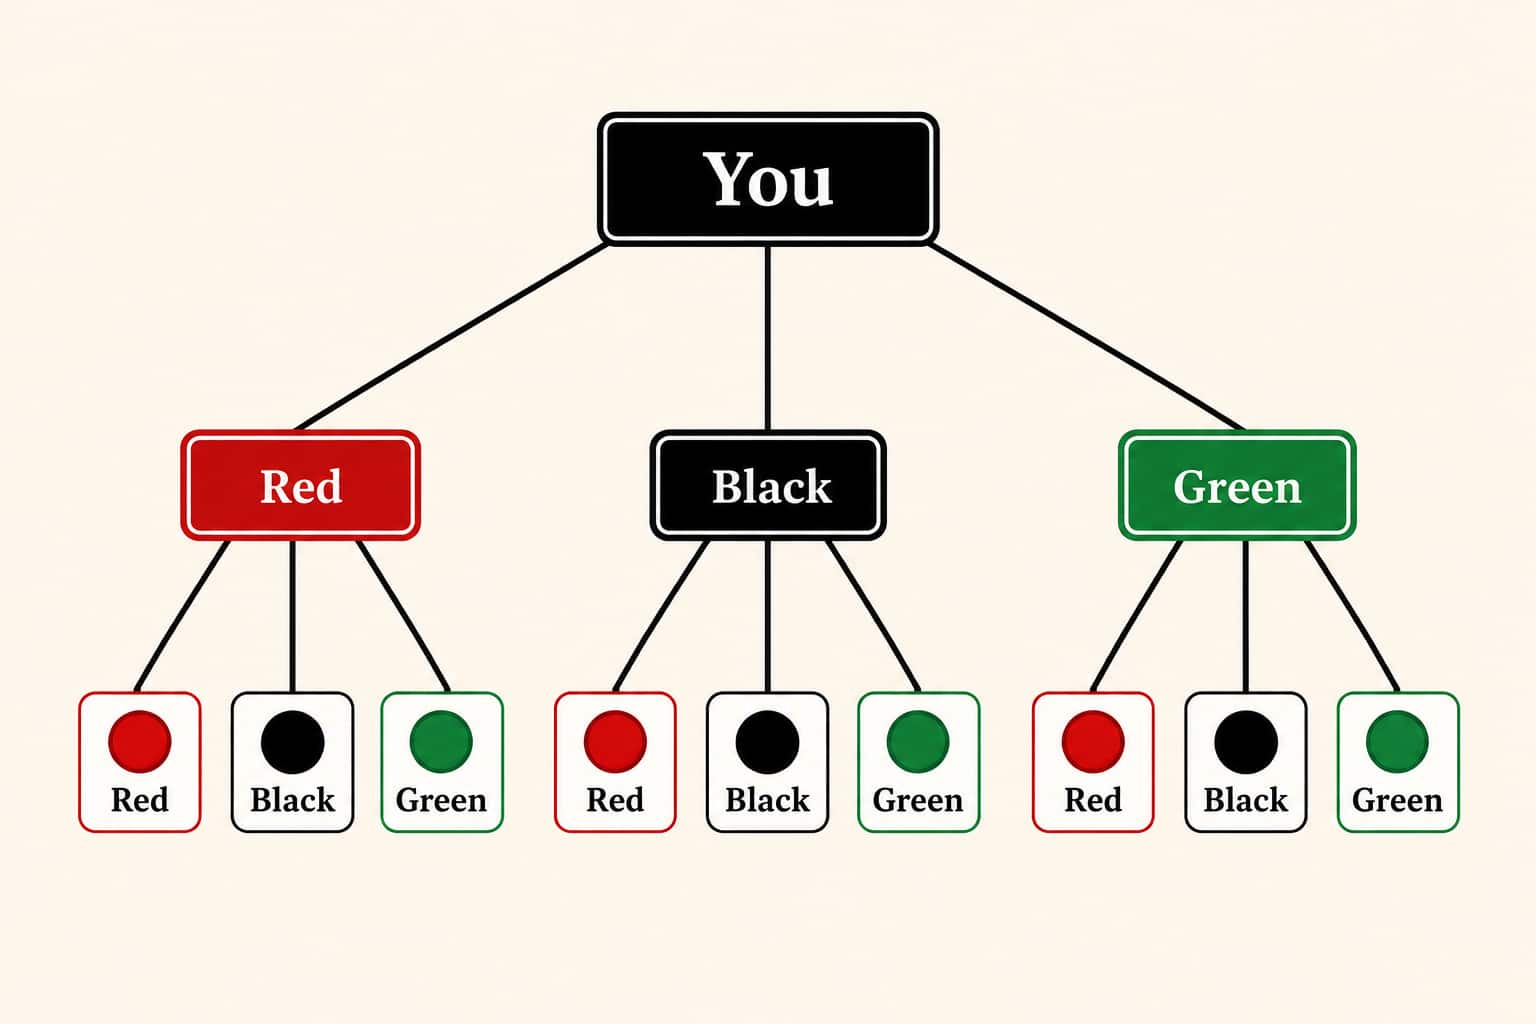
Question 2: Let us say that you have a box containing 3 red pens, 4 black pens and 2 green pens. You pick a pen (without looking) from the box and put it back. Then your friend does the same.
(i) What are the possible outcomes of the pen colours? Can you draw a tree diagram representing the possible outcomes?
(ii) Can you use the tree diagram to guess the probability that both you and your friend pick pens of the same colour?
$\textbf{Answer:}$
(i)
Let's denote the Red pen by R, the black pen by B, and the green pen by G.
So, Possible outcomes are:
{(Red, Green}, (Red, Black), (Red, Red), (Green, Black), (Green, Green), (Black, Black), (Green, Red), (Black, Red), (Black, Green)}
(ii)
Since the pen is replaced, the two picks are independent of each other.
So, probability of getting only a red pen, P(R) $=\frac39=\frac13$
Probability of getting only a black pen, P(B) $=\frac49$
Probability of getting only a green pen, P(G) $=\frac29$
Now, the probability of getting the same colour pens
= P(RR) + P(BB) + P(GG)
= $(\frac13)^2+(\frac49)^2+(\frac29)^2$
$=\frac{1}{9}+\frac{16}{81}+\frac{4}{81}$
$=\frac{9+16+4}{81}=\frac{29}{81}$
So, the probability that both you and your friend pick pens of the same colour is $\frac{29}{81}$.
The Mathematics of Maybe: Introduction to Probability Class 9 Questions and AnswersEnd-of-Chapter Exercises |
Question 1. Fill in the blanks.
(i) The probability of an impossible event is $\_\_\_\_$ .
(ii) The set of all possible outcomes of a random experiment is called the $\_\_\_\_$.
(iii) The probability of an event that is certain to happen is $\_\_\_\_$.
(iv) Tossing a fair coin has a probability of $\_\_\_\_$ for getting heads.
$\textbf{Answer:}$
(i) The probability of an impossible event is 0.
(ii) The set of all possible outcomes of a random experiment is called the sample space.
(iii) The probability of an event that is certain to happen is 1.
(iv) Tossing a fair coin has a probability of $\frac{1}{2}$ for getting heads.
Question 2. In a survey of 50 students, 15 students said they liked football. The number of students who like football is 15, and the $\_\_\_\_$ (frequency/relative frequency) is $\_\_\_\_$ (fill in the fraction or decimal).
$\textbf{Answer:}$
The number of students who like football is 15, and the relative frequency
$=\frac{15}{50}=\frac{3}{10}=0.3$
Hence, the number of students who like football is 15, and the relative frequency is $\frac{15}{50}$ or 0.3.
Question 3. Which of the following experiments have equally likely outcomes? Explain.
(i) A driver attempts to start a car. The car starts or does not start.
(ii) Tossing a fair coin once.
(iii) Rolling a fair 6-sided die.
(iv) Choosing a marble randomly from a bag that contains 3 red marbles and 7 blue marbles.
(v) A baby is born. It is a boy or a girl.
$\textbf{Answer:}$
(i)
Usually, a car is more likely to start than not start.
So, it does not have equally likely outcomes.
(ii)
If we toss a fair coin, we will get either a head or a tail.
Therefore, it has equally likely outcomes.
The outcomes Head (H) and Tail (T) each have probability: $\frac12$
(iii)
Rolling a fair 6-sided die will give us one number among 1, 2, 3, 4, 5, and 6 each time.
Therefore, it has equally likely outcomes.
Each outcome 1, 2, 3, 4, 5, 6 has probability: $\frac16$
(iv)
Choosing a marble randomly from a bag that contains 3 red marbles and 7 blue marbles does not have equally likely outcomes, as Red and blue are not equally likely because there are different numbers of each colour.
Probability of getting a red marble $=\frac{3}{3+7}=\frac3{10}$
Probability of getting a blue marble $=\frac{7}{3+7}=\frac7{10}$
(v)
If a baby is born, it is generally a boy or a girl.
So, it is considered equally likely in elementary probability.
Probability of getting a boy $=\frac12$
Probability of getting a girl $=\frac12$
Question 4. Write the sample space and calculate the probability based on the given information.
(i) Two coins are tossed at the same time. What is the probability of getting at least one head?
(ii) Ten identical cards numbered 1 to 10 are placed in a box. One card is drawn at random. What is the probability of drawing a card with an even number?
(iii) A die is rolled once. What is the probability of getting a number greater than 4?
(iv) A bag contains 3 red balls, 2 blue balls, and 1 green ball. One ball is picked at random. What is the probability that it is not red?
(v) Three coins are tossed simultaneously. What is the probability of getting exactly two heads?
$\textbf{Answer:}$
(i)
Head is denoted by H, and Tail is denoted by T.
Sample space, S = 4 [{HH, TT, HT, TH}]
Probability of getting at least one head $=\frac34$
(ii)
Sample space, S = 10 [{1, 2, 3, 4, 5, 6, 7, 8, 9, 10}]
Even numbers are = 2, 4, 6, 8, 10 [5 instances]
So, the probability of drawing a card with an even number $=\frac{5}{10}=\frac12$
(iii)
Sample space, S = 6 [{1, 2, 3, 4, 5, 6}]
Numbers greater than 4 are = 5, 6 [2 instances]
So, the probability of getting a number greater than 4 $=\frac26=\frac13$
(iv)
Red ball is denoted by R, blue ball is denoted by B, and Green ball is denoted by G.
Sample space, S = 4 [{R, R, R, B, B, G}]
Not red balls count = Blue balls + green balls = 2 + 1 = 3
So, the probability of getting a ball that is not red $=\frac36=\frac12$
(v)
Head is denoted by H, and Tail is denoted by T.
Sample space, S = 8 [{HHH, HHT, HTH, THH, HTT, THT, TTH, TTT}]
We get exactly two heads 3 times.
So, the probability of getting exactly two heads $=\frac38$
Question 5. A bag has 3 candies: strawberry, lemon, and mint. One is picked at random. What is the probability of picking a strawberry candy?
$\textbf{Answer:}$
Sample Space = 3
$\therefore$ Probability of picking a strawberry candy = $\frac13$
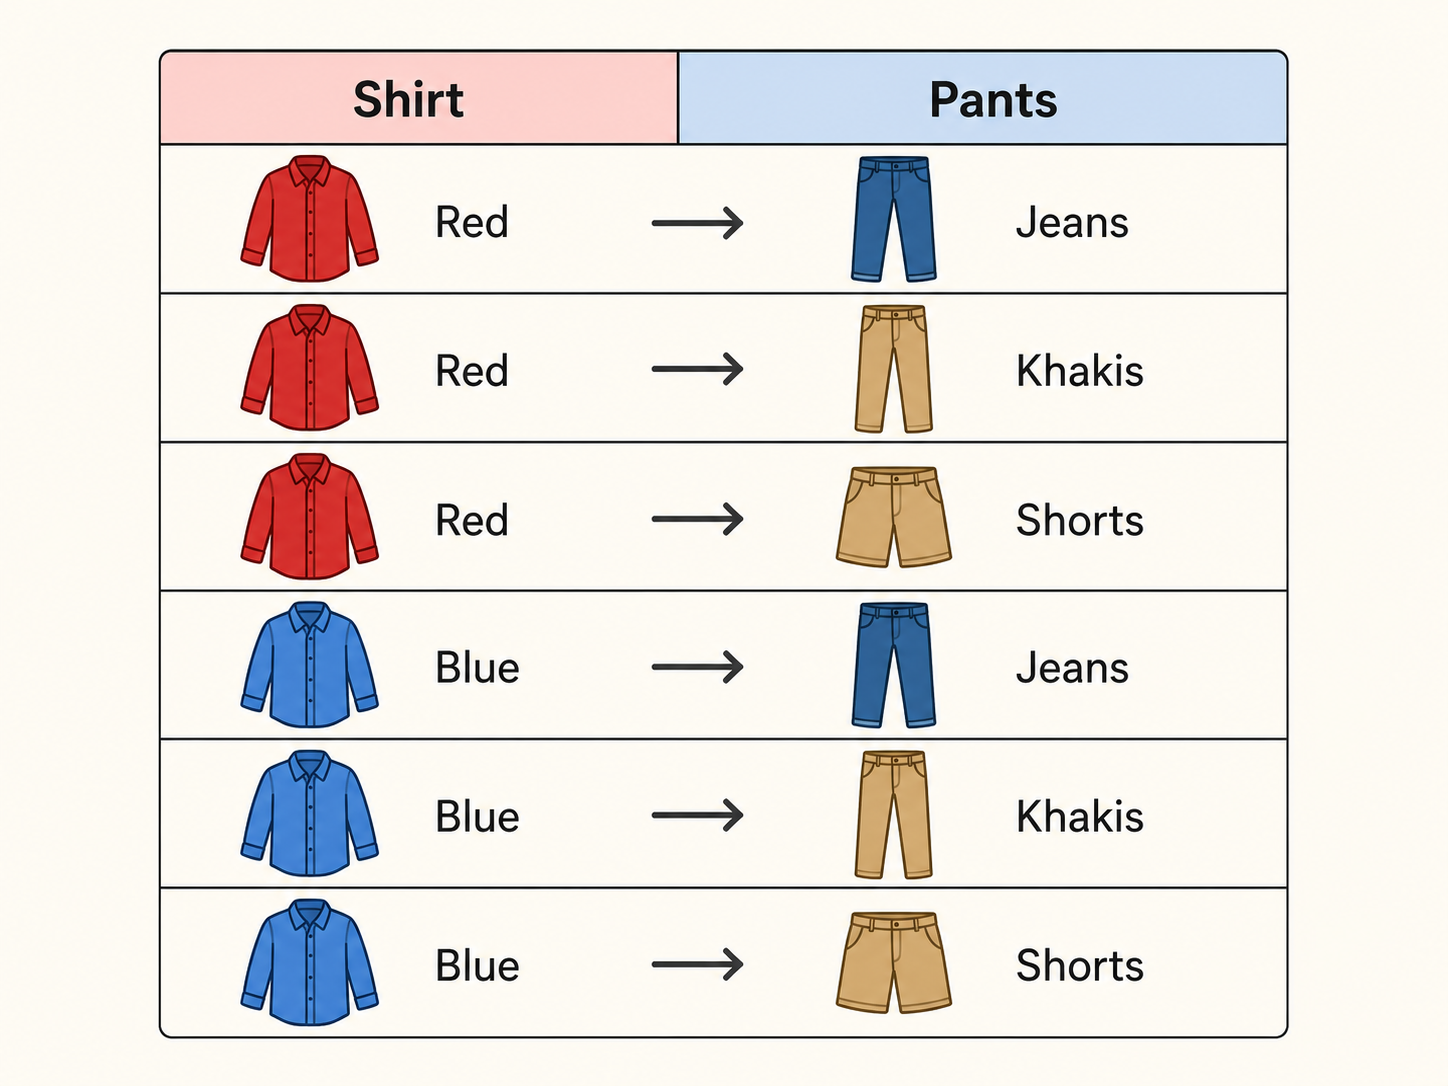
Question 6. A child has 2 shirts (one red and one blue) and 3 types of pants (jeans, khakis, and shorts). List all the possible combinations of outfits consisting of one shirt and one pair of pants. Display your answer in a table format.
$\textbf{Answer:}$
There are 2 × 3 = 6 Possible outcomes.
Outcomes are: {(Red shirt, Jeans), (Red shirt, Khaki), (Red shirt, Shorts), (Blue shirt, Jeans), (Blue shirt, Khaki), (Blue shirt, Shorts)}
Question 7. A tyre company records distances before replacement in 1000 cases.
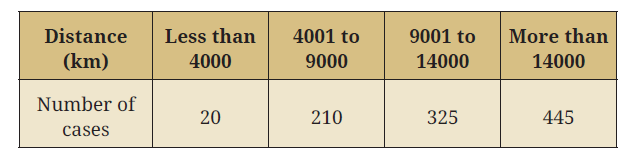
Find the probability that a randomly chosen tyre lasts:
(i) Less than 4000 km.
(ii) Between 4000 and 14000 km.
(iii) More than 14000 km.
$\textbf{Answer:}$
We know that, required probability $=\frac{\text{Total favourable outcomes}}{\text{Total outcomes}}$
(i)
Probability that a randomly chosen tyre lasts less than 4000 km
$=\frac{20}{1000}=\frac1{50}$
(ii)
Probability that a randomly chosen tyre lasts between 4000 and 14000 km
$=\frac{210+325}{1000}=\frac{535}{1000}=\frac{107}{200}$
(iii)
Probability that a randomly chosen tyre lasts more than 14000 km
$=\frac{445}{1000}=\frac{89}{200}$
Question 8. The letters of the word 'PEACE' are placed on cards. Leela draws a card without looking.
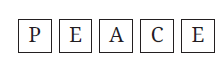
(i) What is the probability that it is a P, E, or C?
(ii) What is the probability that it is not an E?
$\textbf{Answer:}$
The word PEACE has 5 letters.
So, Sample space = 5
(i)
Probability that it is a P, E, or C $=\frac35$
(ii)
Without E, there are 4 letters remaining.
So, the probability that it is not an E $=\frac45$
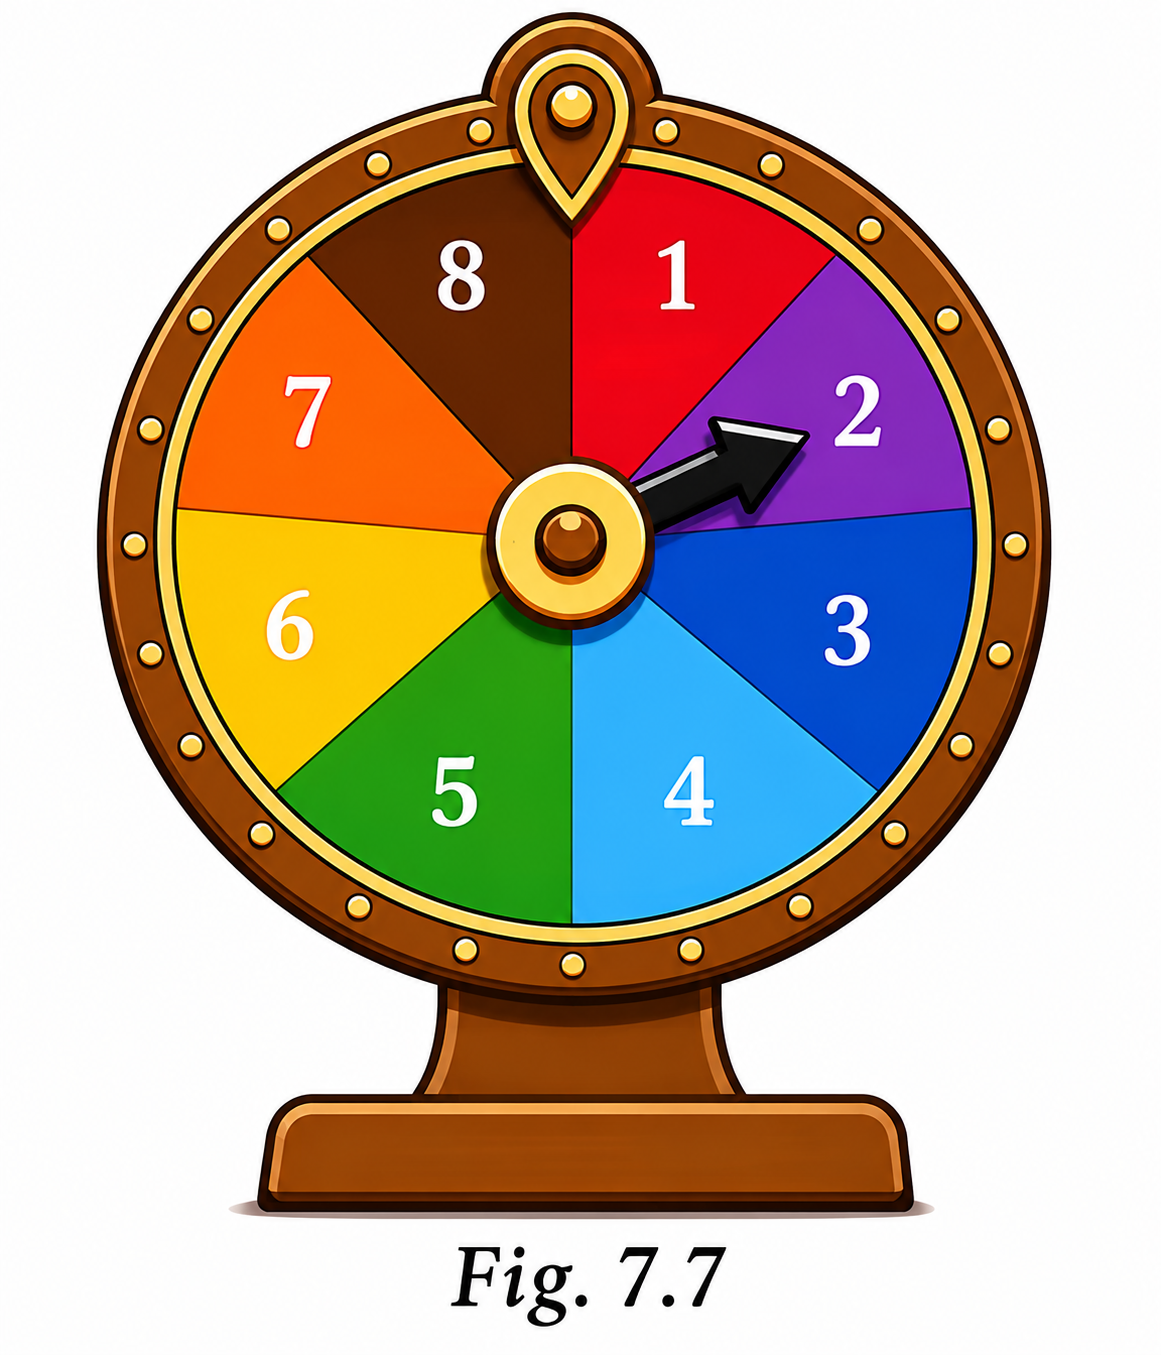
*Question 9. A game of chance consists of spinning an arrow (see Fig. 7.7.) which comes to rest pointing at one of the numbers $1,2,3,4,5,6,7,8$, and these are equally likely outcomes. What is the probability that it will point at
(i) 8?
(ii) An odd number?
(iii) A number greater than 2?
(iv) A number less than 9?
(v) A multiple of 3?
$\textbf{Answer:}$
Sample space = 8 [{1, 2, 3, 4, 5, 6, 7, 8}]
(i)
Probability that it will point at 8 $=\frac18$
(ii)
Odd numbers are: 1, 3, 5, 7 [4 instances]
So, Probability that it will point at an odd number $=\frac48=\frac12$
(iii)
Numbers greater than 2 are: 3, 4, 5, 6, 7, 8 [5 instances]
So, Probability that it will point at a number greater than 2 $=\frac58$
(iv)
Here, all the numbers are less than 9, i.e., 8 numbers.
Hence, Probability that it will point at a number less than 9 $=\frac88=1$
(v)
Multiples of 3 are: 3, 6 [2 instances]
Probability that it will point at a multiple of 3 $=\frac28=\frac14$
*Question 10. A basket contains 4 red balls and 5 blue balls. One ball is drawn and laid aside, and a second ball is drawn. Draw a tree diagram to represent the possible outcomes and probabilities. Use the tree diagram to answer the following questions.
(i) What is the probability of drawing a red ball and then a blue ball?
(ii) What is the probability of drawing 2 blue balls?
$\textbf{Answer:}$
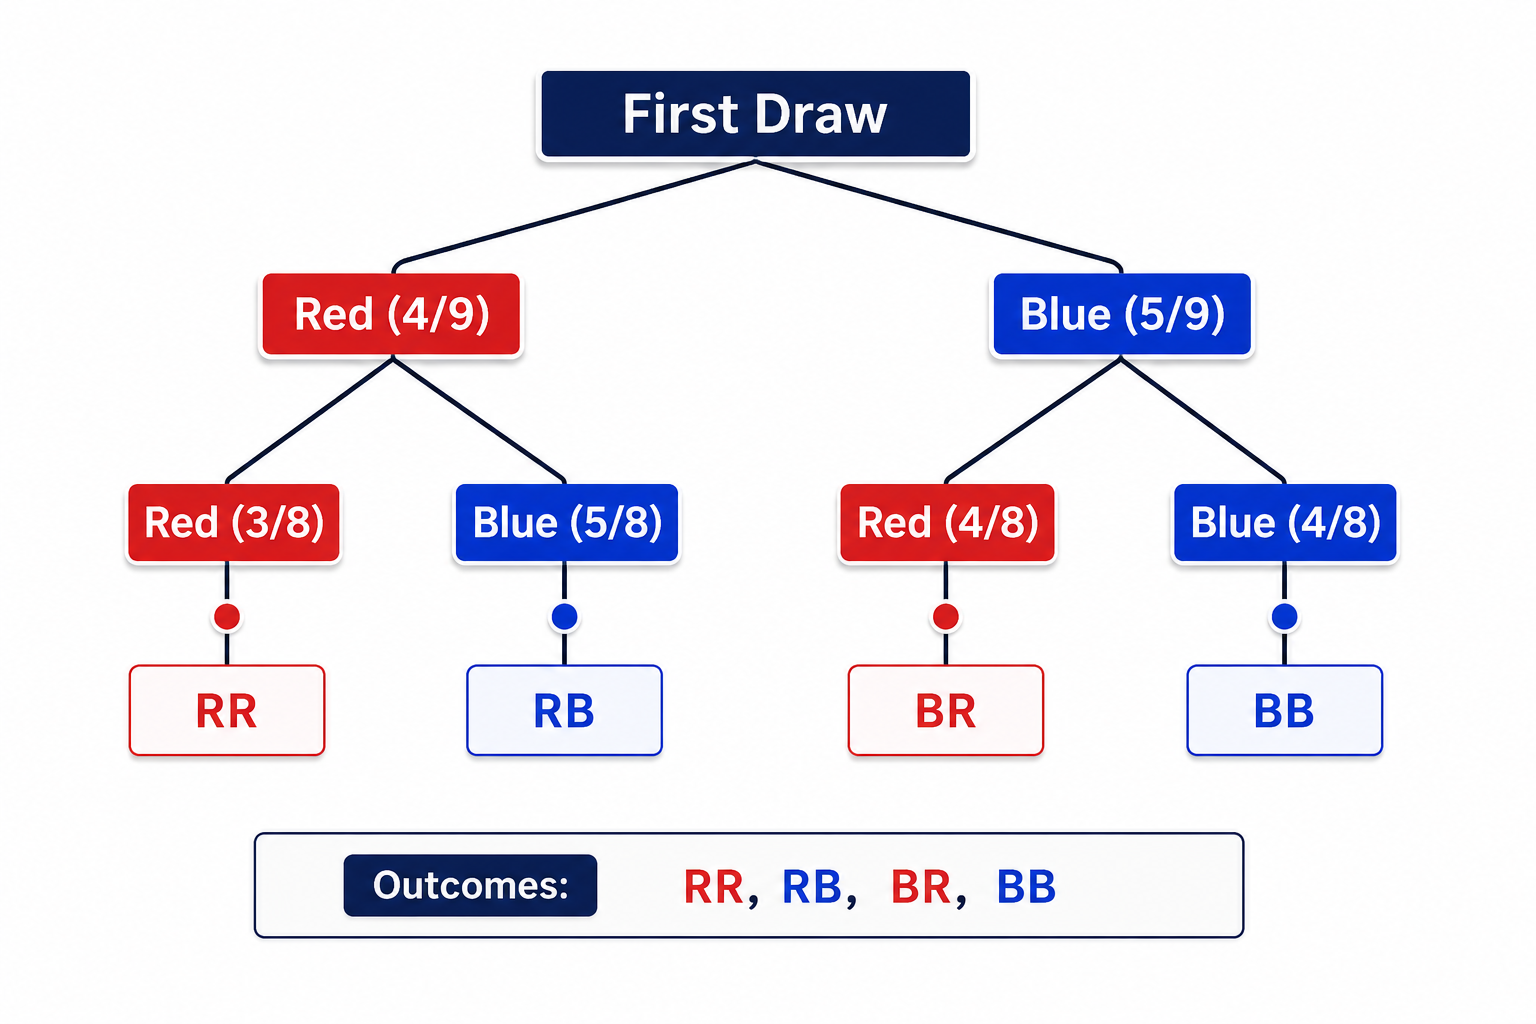
Let's denote the Red ball by R and the blue ball by B.
$\begin{aligned} & P(R R)=\frac{4}{9} \times \frac{3}{8}=\frac{1}{6} \\ & P(R B)=\frac{4}{9} \times \frac{5}{8}=\frac{5}{18} \\ & P(B R)=\frac{5}{9} \times \frac{4}{8}=\frac{5}{18} \\ & P(B B)=\frac{5}{9} \times \frac{4}{8}=\frac{5}{18}\end{aligned}$
(i)
Probability of drawing a red ball and then a blue ball
$=\frac{4}{9} \times \frac{5}{8}=\frac{20}{72}=\frac{5}{18}$
(ii)
Probability of drawing 2 blue balls
$= \frac{5}{9} \times \frac{4}{8}=\frac{5}{18}$
*Question 11. I throw a pair of 6 -sided dice. Write down an event that has a probability of 0 and an outcome that has a probability of 1.
$\textbf{Answer:}$
If I throw a pair of 6 -sided dice, the largest possible sum is 12.
Since the largest possible sum is 12, to get a sum greater than 12 is considered a probability of 0.
For example, getting a sum of 13 has a probability of 0.
The sum between 2 and 12 has a probability of 1, as the minimum number a die can produce is 1. So least sum = 1+ 1 = 2 and maximum sum = 6 + 6 = 12
*Question 12. Write the sample space and calculate the probability based on the given information.
(i) Two dice are rolled. What is the probability that the sum is a prime number greater than 5?
(ii) A bag contains 4 red, 3 green, and 2 blue balls. Two balls are drawn without replacement. What is the probability that both are of different colours?
(iii) Three coins are tossed. What is the probability that the first coin shows heads and exactly two heads occur in total?
(iv) A four-digit number is formed using the digits 1, 2, 3, and 4 with no repetition. What is the probability that the number is even?
(v) A student takes a multiple-choice test with 3 questions, each having 4 options (A, B, C, D), with only one correct answer. What is the probability that the student guesses and gets exactly 2 answers correct?
$\textbf{Answer:}$
(i)
Possible prime sums greater than 5 are 7 and 11. [2 instances]
Total favourable outcomes = {(1,6), (2,5), (3,4), (4,3), (5,2), (6,1), (5,6), (6,5)} = 8 outcomes
Total outcomes = 36
Hence, required probability $=\frac{8}{36}=\frac{2}{9}$
(ii)
Total balls = 4 + 3 + 2 = 9
We know that Coimbination formula, ${ }^n C_r=\frac{n!}{r!(n-r)!}$
where,
n = Number of Total Objects
$r=$ Number of Objects Chosen at Once
Total ways to choose 2 balls $={ }^9 C_2=\frac{9!}{(9-2)!2!}=\frac{9!}{7!\times2!}=\frac{9\times8}2=36$
Total ways to choose Same-colour pairs
$={ }^4 C_2+{ }^3 C_2+{ }^2 C_2=6+3+1=10$
So, Total ways to choose different-colour pairs = 36 - 10 = 26
Hence, required probability $=\frac{26}{36}=\frac{13}{18}$
(iii)
Heads is denoted by H, and Tails is denoted by T.
Favourable outcomes are: HHT and HTH
Total outcomes = 8
Hence, the probability of the first coin showing heads, and exactly two heads occurring in total
$=\frac28=\frac14$
(iv)
Total numbers $=4!=4\times3\times2\times1=24$
Even numbers must end in 2 or 4.
If the units place is filled by 2, the remaining 3 positions can be filled by the remaining 3 digits in $3!=6$ ways.
⇒ Ways ending in $4=3!=6$ ways
⇒ Total favorable outcomes $=6+6=12$
$\therefore$ Required Probability $=\frac{12}{24}=\frac12$
(v)
Random probability of guessing a single question correctly $=\frac14$
Random probability of guessing a single question wrongly $=\frac34$
The event requires exactly 2 correct answers out of 3 questions.
Favorable sequences ={Correct-Correct-Wrong, Correct-Wrong-Crrect, Wrong-Correct-Correct} [3 instances]
The probability of any specific sequence occurring, such as Correct-Correct-Wrong, is the product of its individual probabilities.
So, $\text{Probability of a single sequence} =\left(\frac{1}{4}\right) \times \left(\frac{1}{4}\right) \times \left(\frac{3}{4}\right) = \frac{3}{64}$
$\therefore\text{Total probability for exactly 2 correct} = 3 \times \frac{3}{64}=\frac9{64}$
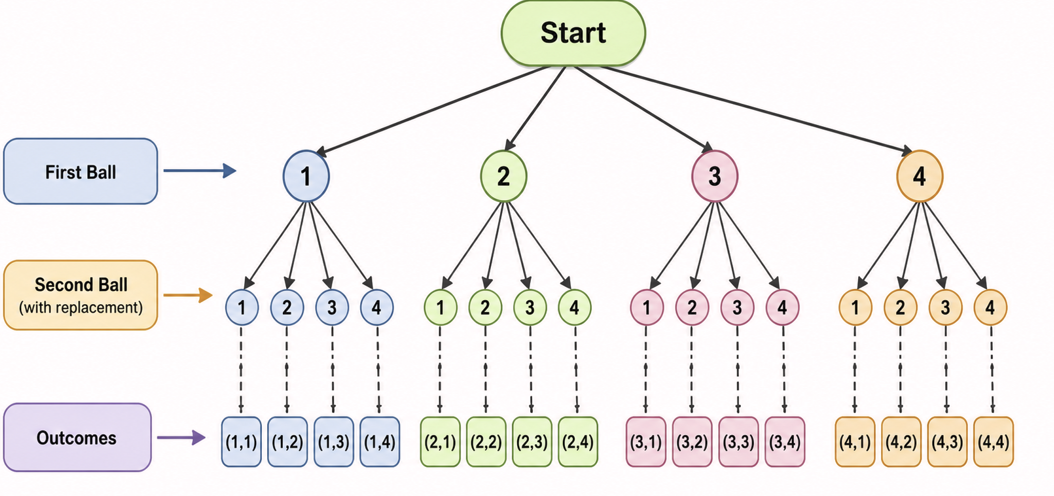
*Question 13. A box contains 4 balls numbered 1 to 4. Record a sample space using a tree diagram for the following experiments:
(i) A ball is drawn, and the number is recorded. Then the ball is returned, and a second ball is drawn and recorded.
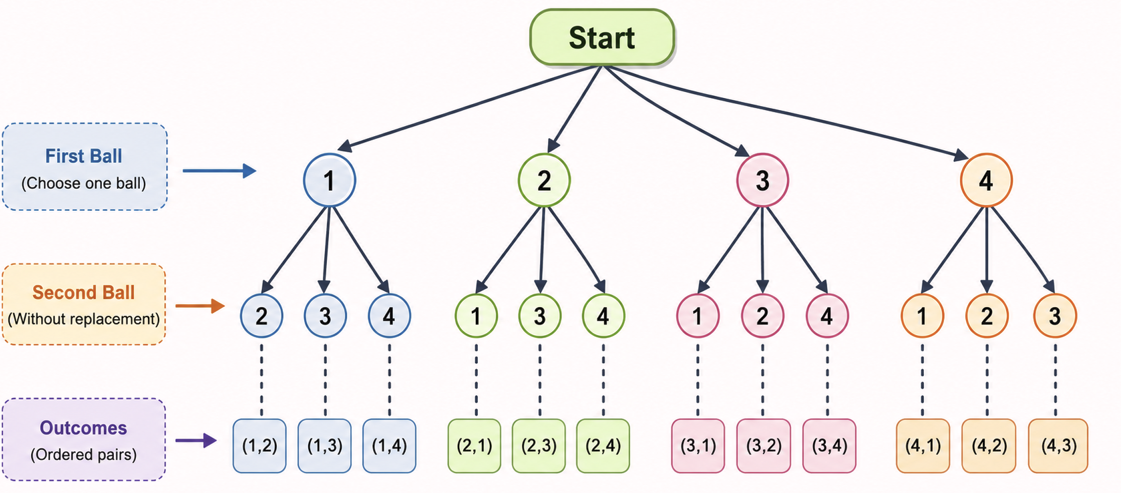
(ii) A ball is drawn and recorded. Without replacing the first ball, the experimenter draws and records a second ball.
(iii) What are the sizes of these two sample spaces?
$\textbf{Answer:}$
The complete sample space $S_1$ is:
$S_1 = \{(1,1), (1,2), (1,3), (1,4), (2,1), (2,2), (2,3), (2,4), (3,1),$
$ (3,2), (3,3), (3,4), (4,1), (4,2), (4,3), (4,4)\}$
(i)
In this experiment, the first ball is drawn and recorded, but is not replaced.
Therefore, the number chosen in the first stage cannot be picked again in the second stage.
Each primary branch for the first draw will only have 3 sub-branches for the second draw.
The complete sample space $S_2$ is:
$S_2 = \{(1,2), (1,3), (1,4), (2,1), (2,3), (2,4), (3,1), (3,2), (3,4), (4,1), (4,2), (4,3)\}$
(ii)
The size of a sample space is determined by counting the total number of final sample points (outcomes) generated at the end of the branches.
For the experiment with replacement, there are 4 independent options for the first draw and 4 independent options for the second draw.
Size of the first sample space $= 4 \times 4 = 16$
For the experiment without replacement, there are 4 options for the first draw and (4 - 1) = 3 remaining options for the second draw.
Size of the second sample space $= 4 \times 3 = 12$
Hence, the size of the first sample space is 16, and the size of the second sample space is 12.
*Question 14. List the elements of a sample space for the simultaneous tossing of a coin and drawing of a card from a set of 6 cards numbered 1 through 6.
$\textbf{Answer:}$
Let the outcomes of the coin toss be denoted by $H$ for heads and $T$ for tails.
The outcomes for the card draw are represented by the integers from the set $\{1, 2, 3, 4, 5, 6\}$.
Outcomes starting with Heads: $\{(H, 1), (H, 2), (H, 3), (H, 4), (H, 5), (H, 6)\}$
Outcomes starting with Tails: $\{(T, 1), (T, 2), (T, 3), (T, 4), (T, 5), (T, 6)\}$
Total outcomes
$= \{(H, 1), (H, 2), (H, 3), (H, 4), (H, 5), (H, 6), (T, 1),$
$ (T, 2), (T, 3), (T, 4), (T, 5), (T, 6)\}$ [12 instances]
We also know that
Total number of outcomes
= Outcomes of a coin toss × Outcomes of a card draw
= 2 × 6 = 12
*Question 15. Three coins are tossed, and the number of heads is recorded. Which of the following lists is a sample space for this experiment? Why do the other lists fail to qualify as a sample space?
(i) $\{1,2,3\}$
(ii) $\{0,1,2\}$
(iii) $\{0,1,2,3,4\}$
(iv) $\{0,1,2,3\}$
$\textbf{Answer:}$
Three coins are tossed, and the number of heads is recorded.
Four scenarios can happen.
- No Heads occur.
- 1 Heads Occur.
- 2 Heads Occur.
- 3 Heads Occur.
Therefore, the sample space is $\{0,1,2,3\}$
Option (1) is not right as there is no option for a zero heads situation.
Option (2) is not right as there is no option for three Heads situation.
Option (3) is not right as it includes 4 heads, which is impossible when only 3 coins are tossed.
*Question 16. Suppose you drop a dye at random on the rectangular region shown in Fig. 7.8. What is the probability that it will land inside the circle with a diameter of 1 m?
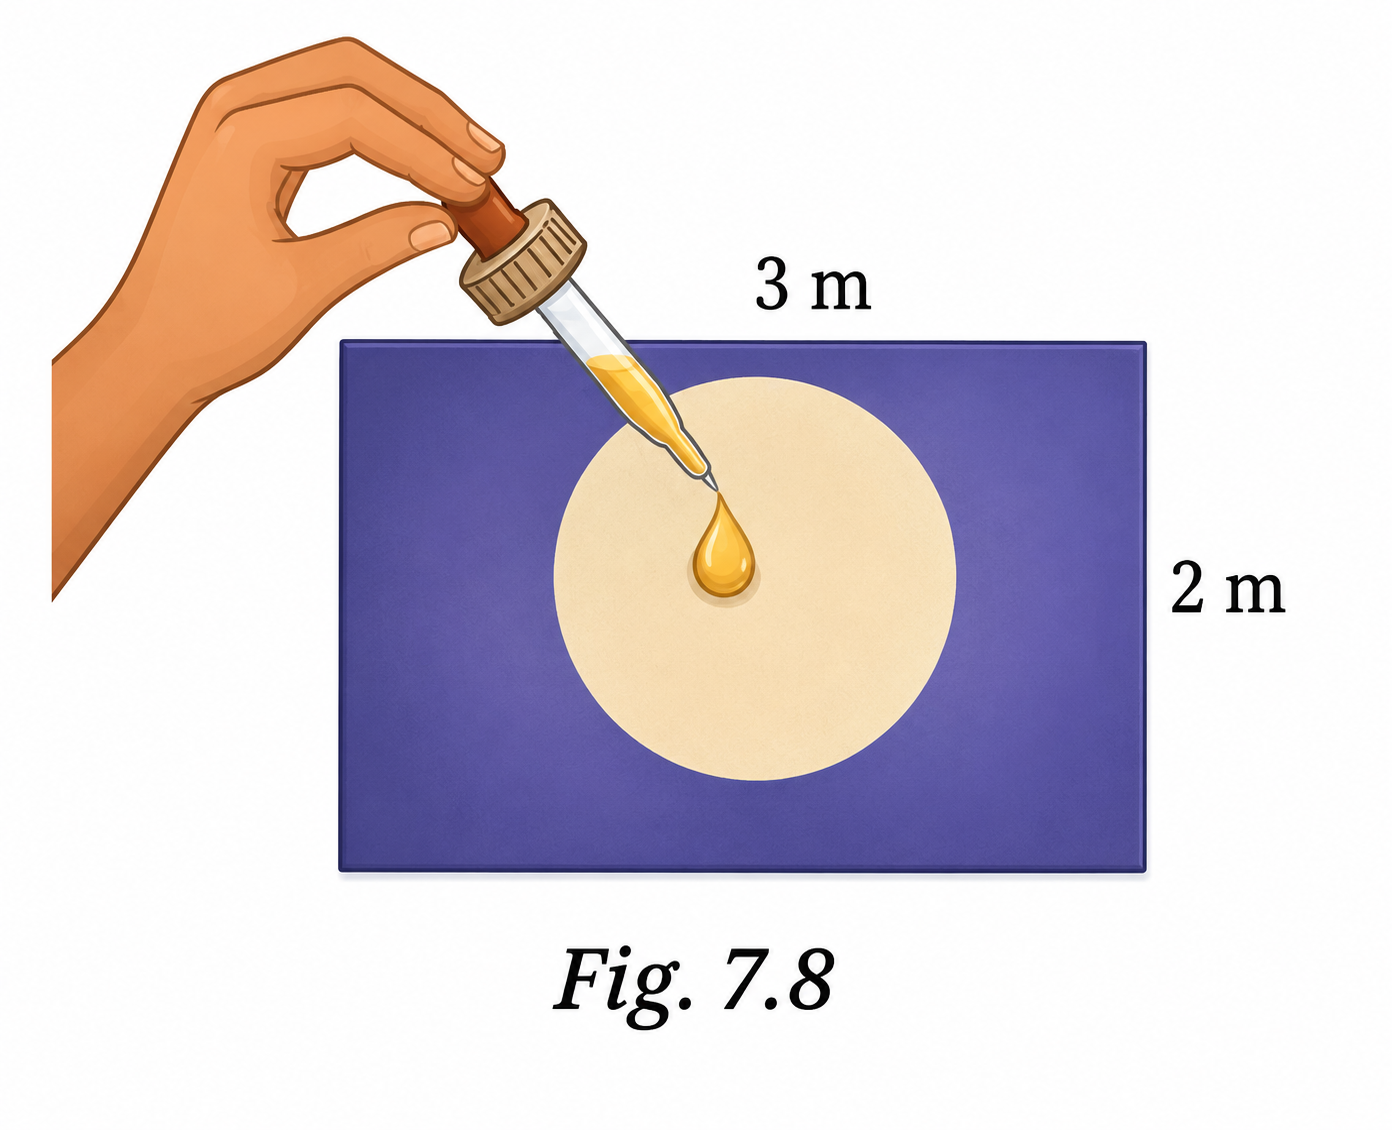
$\textbf{Answer:}$
Given:
Length of the rectangle = 3 cm and Width of the rectangle = 2 cm
$\text{Area of the rectangle} = \text{length} \times \text{width}=3\times2=6\ \text{cm}^2$
The circle has a diameter of 1 m, so its radius, $r$ is $\frac12$
$\therefore\text{Area of the circle} =\pi r^2= \pi \left(\frac{1}{2}\right)^2 = \frac{\pi}{4}\text{ m}^2$
Required Probability
$=\frac{\text { Area of the target circle }}{\text { Area of the entire rectangle }}$
$=\frac{\frac{\pi}{4}}{6}=\frac{\pi}{24}$
If we use $\pi=3.14$,
then, the required probability = $\frac{3.14}{24}\approx0.131$
Confused between CGPA and Percentage?
Get your results instantly with our calculator!
The Mathematics of Maybe: Introduction to Probability Class 9 Chapter 7: Topics
Topics you will learn in NCERT Class 9 Maths Chapter 7 The Mathematics of Maybe: Introduction to Probability include:
- 7.1 What is Probability?
- 7.2 Measuring Probability Objectively
- 7.3 Elements of Probability: Sample Spaces and Events
- 7.4 Tree diagrams
Class 9 Maths NCERT Chapter 7 Solutions: Extra Questions
Question 1:
What is the probability of getting a sum 9 from two throws of a dice?
$\textbf{Answer:}$
Two dice were thrown.
Total outcomes: 36
Outcomes with total as 9 are: $4 \rightarrow\{(3,6),(4,5),(5,4),(6,3)\}$
Required probability:
$P=\frac{4}{36}=\frac{1}{9}$
Hence, the correct answer is $\frac{1}{9}$.
Question 2:
In a box, there are 8 red, 7 blue, and 6 green balls. One ball is picked up randomly. What is the probability that it is neither red nor green?
$\textbf{Answer:}$
Total number of balls $=(8+7+6)=21$
Let $\mathrm{E}=$ the event that the ball drawn is neither red nor green = the event that the ball drawn is blue.
$ \therefore \mathrm{n}(\mathrm{E})=7$
$ \therefore \mathrm{P}(\mathrm{E})=\frac{\mathrm{n}(\mathrm{E})}{\mathrm{n}(\mathrm{~S})}=\frac{7}{21}=\frac{1}{3}$
Hence, the correct answer is $\frac13$.
Question 3:
A bag contains 2 red, 3 green, and 2 blue balls. Two balls are drawn at random. What is the probability that none of the balls drawn is blue?
$\textbf{Answer:}$
Total number of balls = 2 + 3 + 2 = 7
Let $S$ be the sample space.
Then, $n(S)=$ Number of ways of drawing 2 balls out of 7
$ ={ }^7 C_2$
$=\frac{(7 \times 6)}{(2 \times 1)}$
$=21$
Let $\mathrm{E}=$ Event of drawing 2 balls, none of which is blue.
$ \therefore \mathrm{n}(\mathrm{E})=\text { Number of ways of drawing } 2 \text { balls out of }(2+3) \text { balls. }$
$=5 \mathrm{C}_2$
$ =\frac{(5 \times 4)}{(2 \times 1)}$
$=10$
$\therefore \mathrm{P}(\mathrm{E})=\frac{\mathrm{n}(\mathrm{E})}{\mathrm{n}(\mathrm{~S})}=\frac{10}{21}$
Hence, the correct answer is $\frac{10}{21}$.
Question 4:
Tickets numbered 1 to 20 are mixed up, and then a ticket is drawn at random. What is the probability that the ticket drawn has a number which is a multiple of 3 or 5?
$\textbf{Answer:}$
The multiples of 3 to 5 from 1 to 20 are
3, 5, 6, 9, 10,12,15,18, 20.
So, there are 9 numbers.
Thus, the probability that the ticket drawn has a number which is a multiple of 3 to 5 $=\frac{9}{20}$
Hence, the correct answer is $\frac{9}{20}$.
Question 5:
Four dice are thrown simultaneously. Find the probability that all of them show the same face.
$\textbf{Answer:}$
When 4 dice are thrown simultaneously, then the total number of possible outcomes is 6 × 6 × 6 × 6.
The chances that all the dice show the same number (1,1,1,1), (2,2,2,2), (3,3,3,3), (4,4,4,4), (5,5,5,5), (6,6,6,6) T
The chances that all the dice show the same number = 6
∴ The probability is = $\frac{6}{6 \times 6 \times 6 \times 6}=\frac{1}{216}$.
Hence, the correct answer is $\frac{1}{216}$.
NCERT Solutions for Class 9 Maths Chapter Wise
We at Careers360 compiled all the NCERT Class 9 Maths solutions in one place for easy student reference. The following links will allow you to access them.
NCERT Class 9 Books & Syllabus
Before the start of a new academic year, students should refer to the latest syllabus to determine the chapters they’ll be studying. Below are the updated syllabus links, along with some recommended reference books.
Frequently Asked Questions (FAQs)
Probability is a measure of how likely an event is to occur. Its value always lies between 0 and 1.
For a fair coin, there are two equally likely outcomes: Head and Tail.
So, the probability of getting a head = the probability of getting a tail = 1/2
Probability is used in weather forecasting, sports analysis, insurance, medicine, data science, economics, and scientific research to make predictions and decisions under uncertainty.
Free NCERT The Mathematics of Maybe: Introduction to Probability Class 9 solutions are available online on many educational platforms, such as Careers360, in PDF and web formats, covering all exercises with clear, step-by-step explanations.
An impossible event is an event that cannot occur, such as getting 8 on a standard six-sided die.
A tree diagram is a visual representation used to list all possible outcomes of a multi-stage experiment.

Popular Questions
A block of mass 0.50 kg is moving with a speed of 2.00 ms-1 on a smooth surface. It strikes another mass of 1.00 kg and then they move together as a single body. The energy loss during the collision is
| Option 1)
|
Option 2)
|
| Option 3)
|
Option 4)
|
An athlete in the olympic games covers a distance of 100 m in 10 s. His kinetic energy can be estimated to be in the range
| Option 1)
|
Option 2)
|
| Option 3)
|
Option 4)
|
A particle is projected at 600 to the horizontal with a kinetic energy . The kinetic energy at the highest point
| Option 1)
|
Option 2)
|
| Option 3)
|
Option 4)
|
In the reaction,
| Option 1)
|
Option 2)
|
| Option 3)
|
Option 4)
|
How many moles of magnesium phosphate, will contain 0.25 mole of oxygen atoms?
| Option 1)
0.02 |
Option 2)
3.125 × 10⁻² |
| Option 3)
1.25 × 10⁻² |
Option 4)
2.5 × 10⁻² |