Emversity Allied Health Programs
Get Job Ready in Healthcare | Employability-Focused Programs


This exercise teaches the approach to compute median values within datasets divided into categories. The median functions as the central value in datasets after performing an ascending order arrangement. A deep understanding of median calculation from frequency distributions becomes vital since this method provides key information about data centralisation. This exercise shows why median measurements matter in practical applications, which include both income distribution analysis and examination scores and population age examinations.
This Story also Contains
Students will identify the median class and apply the right formula to compute the median through this assignment. The NCERT Solutions preserve their structure based on the newest books introduced for the educational year 2025–26. The given solutions show students how to apply step-by-step procedures for median computation, which improves their ability to understand data described in the NCERT Books. Knowing this concept enables learners to use their apply the learned skills in economics and healthcare sectors and social studies since knowledge of data central values remains vital.
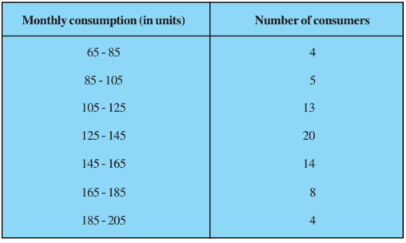
First, we need to find the cumulative frequency and also let the assumed mean be a = 130 and h = 20 and will make the table as follows:
Class | Number of consumers $f_i$ | Cumulative Frequency | Classmark $x_i$ | $d_i = x_i -a$ | $u_i = \frac{d_i}{h}$ | $f_iu_i$ |
65-85 | 4 | 4 | 70 | -60 | -3 | -12 |
85-105 | 5 | 9 | 90 | -40 | -2 | -10 |
105-125 | 13 | 22 | 110 | -20 | -1 | -13 |
125-145 | 20 | 42 | 130 | 0 | 0 | 0 |
145-165 | 14 | 56 | 150 | 20 | 1 | 14 |
165-185 | 8 | 64 | 170 | 40 | 2 | 16 |
185-205 | 4 | 68 | 190 | 60 | 3 | 12 |
$\sum f_i = N$ = 68 | $\sum f_ix_i$ = 7 |
MEDIAN:
As, $N= 68 \implies \frac{N}{2} = 34$
Therfore, Median class = 125-145; Cumulative Frequency = 42; Lower limit, l = 125; c.f. = 22; f = 20; h = 20
$Median = l + \left (\frac{\frac{n}{2}-c.f}{f} \right ).W$
After putting the values, we get:
$\\ = 125 + \left (\frac{34-22}{20} \right ).20 \\ \\ = 125 + 12$
$= 137$
Thus, the median of the data is 137
MODE:
The class having the maximum frequency is the modal class.
The maximum frequency is 20, and hence the modal class = 125 - 145
Lower limit (l) of modal class = 125, class size (h) = 20
Frequency ( $f_1$ ) of the modal class = 20
Frequency ( $f_0$ ) of class preceding the modal class = 13
Frequency ( $f_2$ ) of class succeeding the modal class = 14.
Therefore, $Mode = l + \left(\frac{f_1-f_0}{2f_1 - f_0 - f_2} \right).h$
After putting the values, we get:
$\\ = 125 + \left(\frac{20-13}{2(20)-13-14} \right).20 \\ \\ = 125 + \frac{7}{13}.20$
$= 135.76$
Thus, the Mode of the data is 135.76
MEAN:
$\overline x =a + \frac{\sum f_iu_i}{\sum f_i}\times h$
After putting the values, we get:
$= 130 + \frac{7}{68}\times20 = 137.05$
Thus, the Mean of the data is 137.05
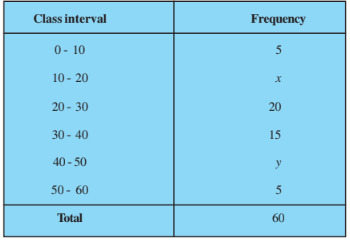
Q2 If the median of the distribution given below is 28.5, find the values of x and y.
Class | Number of consumers $f_i$ | Cumulative Frequency |
0-10 | 5 | 5 |
10-20 | x | 5+x |
20-30 | 20 | 25+x |
30-40 | 15 | 40+x |
40-50 | y | 40+x+y |
50-60 | 5 | 45+x+y |
$\sum f_i = N$ = 60 |
As, $N= 60 \implies \frac{N}{2} = 30$
Given median = 28.5, which lies in the class 20-30
Therefore, Median class = 20-30
Frequency corresponding to median class, f = 20
Cumulative frequency of the class preceding the median class, c.f. = 5 + x
Lower limit, l = 20; Class height, h = 10
Thus, $Median = l + \left (\frac{\frac{n}{2}-c.f}{f} \right ).W$
After putting the values, we get:
$\\ \implies28.5= 20 + \left (\frac{30-5-x}{20} \right ).10 \\ \\ \implies8.5=\frac{25-x}{2} \\ \implies 25-x = 8.5(2) \\ \implies x = 25 - 17 = 8$
Also,
$\\ 60 = 45 + x+y \\ \implies x+y = 60-45 = 15 \\ \implies y = 15-x = 15-8 \ \ \ (\because x =8) \\ \implies y = 7$
Therefore, the required values are: x=8 and y=7
Class | Frequency $f_i$ | Cumulative Frequency |
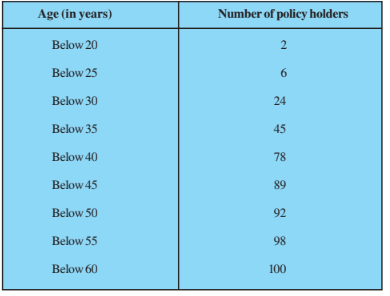
15-20 | 2 | 2 |
20-25 | 4 | 6 |
25-30 | 18 | 24 |
30-35 | 21 | 45 |
35-40 | 33 | 78 |
40-45 | 11 | 89 |
45-50 | 3 | 92 |
50-55 | 6 | 98 |
55-60 | 2 | 100 |
Given, $N= 100 \implies \frac{N}{2} = 50$
Therefore, Median class = 35-45
Frequency corresponding to median class, f = 21
Cumulative frequency of the class preceding the median class, c.f. = 24
Lower limit, l = 35; Class height, h = 10
Therefore, $Median = l + \left (\frac{\frac{n}{2}-c.f}{f} \right ).W$
After putting in the values, we get:
$\\ = 35 + \left (\frac{50-45}{33} \right ).5 \\ \\$
$= 35.75$
Thus, the median age is 35.75 years.
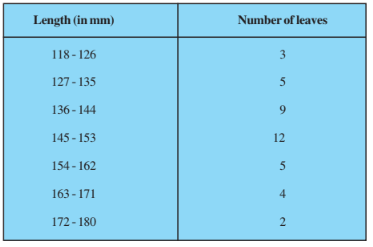
Find the median length of the leaves.
(Hint: The data needs to be converted to continuous classes for finding the median since the formula assumes continuous classes. The classes then change to
117.5 - 126.5, 126.5 - 135.5, . . ., 171.5 - 180.5.)
The data needs to be converted to continuous classes for finding the median, since the formula assumes continuous classes.
Class | Frequency $f_i$ | Cumulative Frequency |
117.5-126.5 | 3 | 3 |
126.5-135.5 | 5 | 8 |
135.5-144.5 | 9 | 17 |
144.5-153.5 | 12 | 29 |
153.5-162.5 | 5 | 34 |
162.5-171.5 | 4 | 38 |
171.5-180.5 | 2 | 40 |
As,$ N= 40 \implies \frac{N}{2} = 20$
Therefore, Median class = 144.5-153.5
Lower limit, l = 144.5; Class height, h = 9
Frequency corresponding to median class, f = 12
Cumulative frequency of the class preceding the median class, c.f. = 17
$Median = l + \left (\frac{\frac{n}{2}-c.f}{f} \right ).W$
After putting in the values, we get:
$\\ = 144.5 + \left (\frac{20-17}{12} \right ).9 \\ \\$
$= 146.75$
Thus, the median length of the leaves is 146.75 mm
Q5 The following table gives the distribution of the lifetime of 400 neon lamps: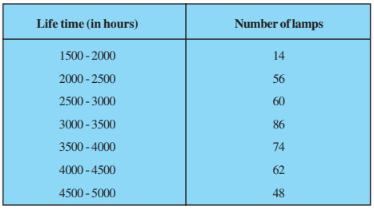
Find the median lifetime of a lamp.
Class | Frequency $f_i$ | Cumulative Frequency |
1500-2000 | 14 | 14 |
2000-2500 | 56 | 70 |
2500-3000 | 60 | 130 |
3000-3500 | 86 | 216 |
3500-4000 | 74 | 290 |
4000-4500 | 62 | 352 |
4500-5000 | 48 | 400 |
$ N= 400 \implies \frac{N}{2} = 200$
Therefore, Median class = 3000-3500
Lower limit, l = 3000; Class height, h = 500
Frequency corresponding to median class, f = 86
Cumulative frequency of the class preceding the median class, c.f. = 130
$Median = l + \left (\frac{\frac{n}{2}-c.f}{f} \right ).W$
After putting in the values, we get:
$\\ = 3000 + \left (\frac{200-130}{86} \right ).500 \\ \\ = 3000+406.97$
$= 3406.97$
Thus, the median lifetime of a lamp is 3406.97 hours
$= 146.75$
Thus, the median length of the leaves is 146.75 mm
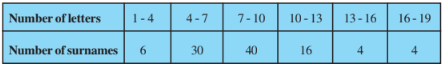
Determine the median number of letters in the surnames. Find the mean number of letters in the surnames? Also, find the modal size of the surnames.
Class | Number of surnames $f_i$ | Cumulative Frequency | Classmark $x_i$ | $f_ix_i$ |
1-4 | 6 | 6 | 2.5 | 15 |
4-7 | 30 | 36 | 5.5 | 165 |
7-10 | 40 | 76 | 8.5 | 340 |
10-13 | 16 | 92 | 11.5 | 184 |
13-16 | 4 | 96 | 14.5 | 51 |
16-19 | 4 | 100 | 17.5 | 70 |
$\sum f_i = N$ = 100 | $\sum f_ix_i$ = 825 |
MEDIAN:
$N= 100 \implies \frac{N}{2} = 50$
$\therefore$ Median class = 7-10; Lower limit, l = 7;
Cumulative frequency of preceding class, c.f. = 36; f = 40; h = 3
$Median = l + \left (\frac{\frac{n}{2}-c.f}{f} \right ).W$
After putting in the values, we get:
$\\ = 7+ \left (\frac{50-36}{40} \right ).3 \\ \\$
$= 8.05$
Thus, the median of the data is 8.05
MODE:
The class having the maximum frequency is the modal class.
The maximum frequency is 40, and hence the modal class = 7-10
Lower limit (l) of modal class = 7, class size (h) = 3
Frequency ( $f_1$ ) of the modal class = 40
Frequency ( $f_0$ ) of class preceding the modal class = 30
Frequency ( $f_2$ ) of class succeeding the modal class = 16
$Mode = l + \left(\frac{f_1-f_0}{2f_1 - f_0 - f_2} \right).h$
After putting in the values, we get:
$\\ = 7 + \left(\frac{40-30}{2(40)-30-16} \right).3 \\ \\ = 125 + \frac{10}{34}.3$
$= 7.88$
Thus, the Mode of the data is 7.88
MEAN:
$\overline x =\frac{\sum f_ix_i}{\sum f_i}$
$= \frac{825}{100} = 8.25$
Thus, the Mean of the data is 8.25
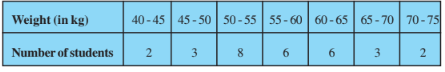
Class | Number of students $f_i$ | Cumulative Frequency |
40-45 | 2 | 2 |
45-50 | 3 | 5 |
50-55 | 8 | 13 |
55-60 | 6 | 19 |
60-65 | 6 | 25 |
65-70 | 3 | 28 |
70-75 | 2 | 30 |
MEDIAN:
$N= 30 \implies \frac{N}{2} = 15$
Therefore, Median class = 55-60; Lower limit, l = 55;
Cumulative frequency of preceding class, c.f. = 13; f = 6; h = 5
$Median = l + \left (\frac{\frac{n}{2}-c.f}{f} \right ).W$
After putting in the values, we get:
$\\ = 55+ \left (\frac{15-13}{6} \right ).5 \\ \\ = 55+\frac{2}{6}.5$
$= 56.67$
Thus, the median weight of the student is 56.67 kg
Also Read-
Get your results instantly with our calculator!
1. Understanding Median for Grouped Data: The concept of Median for grouped data demonstrates how central values separate statistical sets into two balanced sections for data that includes class intervals.
2. Identifying the Median Class: The process of identifying the Median Class enables you to find which interval contains the median because it serves as the fundamental step for calculating the median in grouped data.
3. Applying the Median Formula: When calculating the median, apply statistical formulas that include the lower end of the median class, its width and cumulative frequency figures.
4. Solving Real-Life Based Word Problems: The resolution of real-life word problems requires frequency tables that stem from actual survey results or performance scores to find the central value.
5. Interpreting Data Trends: Students should learn to recognise meaningful conclusions based on trends and patterns within frequency groups of raw data.
Check Out:
Students must check the NCERT solutions for class 10 of the Mathematics and Science Subjects.
Students must check the NCERT Exemplar solutions for class 10 of the Mathematics and Science Subjects.
Frequently Asked Questions (FAQs)
The concepts related to median is discussed in class 10 maths ex 14.3. Formula of median of even observation is (n/2+ 1 )th observation. Also practice class 10 ex 14.3 which is discussed in this article to get deeper understanding of the concepts.
3 Median = Mode + 2 Mean is the relation between mean, medium and mode as mentioned in Class 10 maths chapter 14 exercise 14.3.
These concepts are discussed in 10th class maths exercise 14.3 answers. practice them to command the concepts. Cumulative Frequency Table is the cumulative frequency is calculated by adding each frequency from a frequency distribution table to the sum of its predecessors.
Median gives the value of the observation which is at the center so it is dependent on either the observation is odd number or even number. Practice ex 14.3 class 10 to command these concepts.
The concept related to discusses in class 10 ex 14.3. Formula of median of odd observation is n/2th observation. Students can practice ex 14.3 class 10 to get deeper understanding of concepts.

On Question asked by student community
Hello Dear Student,
You can get directly find, check, get more information here:
Hope it helps!
Hello Student,
If you are asking how to download the migration certificate for Class 10 Karnataka Board, here is how to do it -
You will have to log in to the DigiLocker app or website using your Aadhaar card number and the registered mobile number for the OTP.
You
Hello Student,
The CBSE Class 10th board exam supplementary results can be announced in the second week of July. You can visit the official websites for the results. You will have to enter your roll number, school number, and the admit card ID.
I am also sharing a link of
Hi!
Given below are the links to access the CBSE Class 10th exam pattern:
https://school.careers360.com/exams/cbse-class-10th
https://school.careers360.com/boards/cbse/cbse-10th-exam-pattern
Stay updated.
Hello Ananya,
Please specify the class for which you need the question papers. I am providing Class 10 and 12 papers.
Here are the links to the CBSE Half-yearly Question Papers (2025-2026).
A block of mass 0.50 kg is moving with a speed of 2.00 ms-1 on a smooth surface. It strikes another mass of 1.00 kg and then they move together as a single body. The energy loss during the collision is
| Option 1)
|
Option 2)
|
| Option 3)
|
Option 4)
|
An athlete in the olympic games covers a distance of 100 m in 10 s. His kinetic energy can be estimated to be in the range
| Option 1)
|
Option 2)
|
| Option 3)
|
Option 4)
|
A particle is projected at 600 to the horizontal with a kinetic energy . The kinetic energy at the highest point
| Option 1)
|
Option 2)
|
| Option 3)
|
Option 4)
|
In the reaction,
| Option 1)
|
Option 2)
|
| Option 3)
|
Option 4)
|
How many moles of magnesium phosphate, will contain 0.25 mole of oxygen atoms?
| Option 1)
0.02 |
Option 2)
3.125 × 10⁻² |
| Option 3)
1.25 × 10⁻² |
Option 4)
2.5 × 10⁻² |
Register for iACST. Get instant Scholarship on NEET Repeater Courses.
Study at a world-renowned UK university in India | Admissions open for UG & PG programs.
Apply for UG & PG programmes from Victoria University, Delhi NCR Campus
Admissions open for UG & PG programs at Illinois Tech Mumbai
Apply for UG & PG courses at University of Aberdeen, Mumbai Campus
UG & PG Admissions open for CS/AI/Business/Economics & other programmes.