JEE Main Important Chemistry formulas
As per latest syllabus. Chemistry formulas, equations, & laws of class 11 & 12th chapters


Knowledge about data patterns in grouped data formats enables better interpretation of real-world trends in the data. This part of the chapter explores mode as a central tendency measure used to determine the most recurrent value in a dataset. The mode is crucial in statistical assessment, especially when data exists in interval groups. We evaluate patterns in the most recurring data points by utilising graphical and algebraic tools in this research. This exercise demonstrates to students how to calculate the mode for grouped data by using an appropriate formula.
This Story also Contains

The NCERT Solutions featured here apply to the latest version of National Council of Educational Research and Training books from the 2025–2026 school year. The solutions guide students to break down the procedure of locating the modal class, then use the proper formula to find the mode. Knowledge mastery of this topic enables students to apply their learned skills in economic research and healthcare, and social science investigations because they need to find and understand dominant patterns. The exercise functions as an essential tool for solidifying the knowledge described in NCERT Books.
Q1 The following table shows the ages of the patients admitted in a hospital during a year:
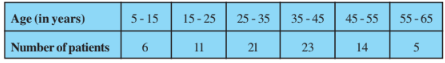
Find the mode and the mean of the data given above. Compare and interpret the two measures of central tendency.
To find the modal class: The class having the maximum frequency is the modal class. And, the maximum frequency is 23, and hence the modal class = 35-45
Thus, Lower limit (l) of modal class = 35, class size (h) = 10
Frequency (
Frequency (
Frequency (
Therefore,
Now,
Age | Number of patients | Classmark | |
5-15 | 6 | 10 | 60 |
15-25 | 11 | 20 | 220 |
25-35 | 21 | 30 | 630 |
35-45 | 23 | 40 | 920 |
45-55 | 14 | 50 | 700 |
55-65 | 5 | 60 | 300 |
=80 | =2830 |
Mean,
Therefore, the maximum number of patients is in the age group of 36.8, whereas the average age of all the patients is 35.37.
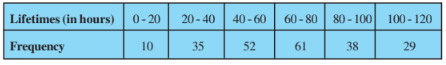
Determine the modal lifetimes of the components.
To find the modal class: The class having the maximum frequency is the modal class. And, the maximum frequency is 61, and hence the modal class = 60-80
Thus, Lower limit (l) of modal class = 60, class size (h) = 20
Frequency (
Frequency (
Frequency (
Therefore,
Thus, the modal lifetime of 225 electrical components is 65.62 hours
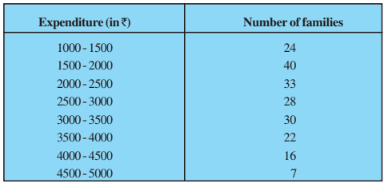
To find the modal class: The class having the maximum frequency is the modal class. And, the maximum frequency is 40, and hence the modal class = 1500-2000
Thus, Lower limit (l) of modal class = 1500, class size (h) = 500
Frequency (
Frequency (
Frequency (
Therefore,
Thus, the Mode of the data is Rs. 1847.82
Now,
Let the assumed mean be a = 2750 and h = 500
Expenditure | Number of families | Classmark | | | |
1000-1500 | 24 | 1250 | -1500 | -3 | -72 |
1500-2000 | 40 | 1750 | -1000 | -2 | -80 |
2000-2500 | 33 | 2250 | -500 | -1 | -33 |
2500-3000 | 28 | 2750 | 0 | 0 | 0 |
3000-3500 | 30 | 3250 | 500 | 1 | 30 |
3500-4000 | 22 | 3750 | 1000 | 2 | 44 |
4000-4500 | 16 | 4250 | 1500 | 3 | 48 |
4500-5000 | 7 | 4750 | 2000 | 4 | 28 |
=200 | = -35 |
Mean,
Thus, the Mean monthly expenditure is Rs. 2662.50
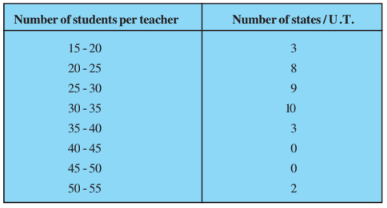
To find the modal class: The class having the maximum frequency is the modal class. And, the maximum frequency is 10, and hence the modal class = 30-35
Lower limit (l) of modal class = 30, class size (h) = 5
Frequency (
Frequency (
Frequency (
Therefore,
Thus, the Mode of the data is 30.625
Now,
Let the assumed mean be a = 32.5 and h = 5
Class | Number of states | Classmark | | | |
15-20 | 3 | 17.5 | -15 | -3 | -9 |
20-25 | 8 | 22.5 | -10 | -2 | -16 |
25-30 | 9 | 27.5 | -5 | -1 | -9 |
30-35 | 10 | 32.5 | 0 | 0 | 0 |
35-40 | 3 | 37.5 | 5 | 1 | 3 |
40-45 | 0 | 42.5 | 10 | 2 | 0 |
45-50 | 0 | 47.5 | 15 | 3 | 0 |
50-55 | 2 | 52.5 | 20 | 4 | 8 |
=35 | = -23 |
Mean,
Thus, the Mean of the data is 29.22
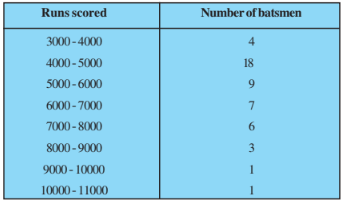
Find the mode of the data.
To find the modal class: The class having the maximum frequency is the modal class. And, the maximum frequency is 18, and hence the modal class = 4000-5000
Lower limit (l) of modal class = 4000, class size (h) = 1000
Frequency (
Frequency (
Frequency (
Therefore,
Thus, the Mode of the data is 4608.70
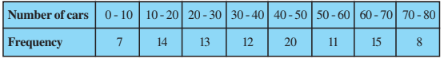
To find the modal class: The class having the maximum frequency is the modal class. And, the maximum frequency is 20, and hence the modal class = 40-50
Lower limit (l) of modal class = 40, class size (h) = 10
Frequency (
Frequency (
Frequency (
Therefore,
Thus, the Mode of the data is 44.70
Also Read-
Get your results instantly with our calculator!
1. Understanding Mode for Grouped Data: Learning Mode for Grouped Data shows how this statistical value represents the dominant entry, which occurs most often, especially when data is grouped into intervals.
2. Identifying the Modal Class: A practical method to discover the Modal Class describes the procedure for identifying the class interval with maximum frequency, as it serves as the foundation for calculating the mode.
3. Applying the Mode Formula: Statistical calculation of mode requires the lower class limit of the modal interval alongside the interval width and counts from the modal group, together with adjacent classes.
4. Solving Real-Life Based Word Problems: Students will solve real-life based word problems using frequency tables that originate from survey results or performance scores to establish the most common outcome.
5. Interpreting Data Trends: Those who master the ability to examine organised frequency distributions can form substantial conclusions from original data patterns.
Check Out-
Students must check the NCERT solutions for class 10 of the Mathematics and Science Subjects.
Students must check the NCERT Exemplar solutions for class 10 of the Mathematics and Science Subjects.
Frequently Asked Questions (FAQs)
These concepts are discussed ex 14.2 class 10 comprehensively. With the help of mode , median and mean we can measure central tendency of a data. Practice this exercise to command these concepts.
These concepts are discussed in class 10 maths ex 14.2 . The data which have more than one value which are repeated in same frequency are called multimodal data. Practice the problems to command these concepts.
These concepts are discussed in 10th class maths exercise 14.2 answers. Modal class is the class which have maximum frequency or we can say that the class which has highest occurring value in the data. Practice these problems to command the concepts.
l = modal class's lowest limit
h = denotes the length of the class interval (assuming all class sizes to be equal)
f ₁ =represents the frequency of the modal class
f ₀ =represents the frequency of the class preceding the modal class
f ₂ = represents the frequency of the class following the modal class.
There are six questions in class 10 ex 14.2. Practice these problems to command the concepts.
This ex 14.2 class 10 discuss about the concept of Central tendency refers to the centre value of all observations.
There are three problems based on the nature of root that are solved before the Class 10 Mathematics chapter 14 exercise 14.2.

On Question asked by student community
Hello Arun,
The CBSE Class 10 mid-term exam has yet to happen. In the meantime, please refer to the previous year's question paper:
https://school.careers360.com/boards/cbse/cbse-class-10-mid-term-exam-question-paper-answer-key-2025-26
Hello Dear Student,
You can get directly find, check, get more information here:
Hope it helps!
Hello Student,
If you are asking how to download the migration certificate for Class 10 Karnataka Board, here is how to do it -
You will have to log in to the DigiLocker app or website using your Aadhaar card number and the registered mobile number for the OTP.
You
Hello Student,
The CBSE Class 10th board exam supplementary results can be announced in the second week of July. You can visit the official websites for the results. You will have to enter your roll number, school number, and the admit card ID.
I am also sharing a link of
A block of mass 0.50 kg is moving with a speed of 2.00 ms-1 on a smooth surface. It strikes another mass of 1.00 kg and then they move together as a single body. The energy loss during the collision is
| Option 1)
|
Option 2)
|
| Option 3)
|
Option 4)
|
An athlete in the olympic games covers a distance of 100 m in 10 s. His kinetic energy can be estimated to be in the range
| Option 1)
|
Option 2)
|
| Option 3)
|
Option 4)
|
A particle is projected at 600 to the horizontal with a kinetic energy . The kinetic energy at the highest point
| Option 1)
|
Option 2)
|
| Option 3)
|
Option 4)
|
In the reaction,
| Option 1)
|
Option 2)
|
| Option 3)
|
Option 4)
|
How many moles of magnesium phosphate, will contain 0.25 mole of oxygen atoms?
| Option 1)
0.02 |
Option 2)
3.125 × 10⁻² |
| Option 3)
1.25 × 10⁻² |
Option 4)
2.5 × 10⁻² |
Study at a world-renowned UK university in India | Admissions open for UG & PG programs.
Apply for UG & PG programmes from Victoria University, Delhi NCR Campus
Admissions open for UG & PG programs at Illinois Tech Mumbai
Apply for UG & PG courses at University of Aberdeen, Mumbai Campus
UG & PG Admissions open for CS/AI/Business/Economics & other programmes.
Bristol's expertise meets Mumbai's innovation. Admissions open for UG & PG programmes