NCERT Solutions for Class 7 Maths Chapter 3 A Peek beyond the Point
Understanding decimals and fractions is an integral part of building a strong foundation in mathematics. You need to have a proper understanding of what decimals and fractions are and how to convert them easily to start your mathematical journey in the higher classes. Class 7 Maths NCERT Chapter 3 A Peek beyond the Point provides students with a clear understanding of tenths, hundredths, and thousandths of a number, as well as the need for smaller units, their applications in everyday life, and how to compare them. Therefore, it is essential to understand this chapter with a proper understanding and clarity, and this is where the NCERT Solutions for Class 7 Maths come into play.
This Story also Contains
- NCERT Solutions for Class 7 Maths Chapter 3 A Peek beyond the Point: Download PDF
- NCERT Solutions for Class 7 Maths Chapter 3: A Peek beyond the Point: Exercise
- A Peek beyond the Point Class 7 NCERT Solutions: Topics
- Class 7 Maths Chapter 3 A Peek beyond the Point Solutions: Extra Question
- NCERT Class 7 Maths Chapter 3 A Peek beyond the Point Notes
- NCERT Solutions for Class 7 Maths Chapter Wise
- NCERT Books and NCERT Syllabus
These NCERT Solutions provide detailed and step-by-step explanations for the students. With the help of these Class 7 Maths Chapter 3 Solutions, they can practice the problems, verify their answer and strengthen their weak areas that need improvement. This will also clear their doubts and provide them with a proper understanding of the chapter's concepts. These NCERT Solutions for Class 7 are trustworthy and reliable, as they are created by subject matter experts at Careers360, making them an essential resource for exam preparation. In many schools, teachers use NCERT resources to guide their teaching plans. For full syllabus coverage and solved exercises as well as a downloadable PDF, please visit this NCERT article.
NCERT Solutions for Class 7 Maths Chapter 3 A Peek beyond the Point: Download PDF
Careers360 brings you NCERT Class 7 Maths Chapter 3 A Peek beyond the Point solutions, carefully prepared by subject experts to simplify your studies and help in exams. A downloadable PDF has been provided — click on the link below to access it.
NCERT Solutions for Class 7 Maths Chapter 3: A Peek beyond the Point: Exercise
Below are the detailed NCERT Class 7 Maths Chapter 3 A Peek beyond the Point question answers provided in the textbook.
|
A Peek beyond the Point Class 7 Question Answers |
Figure it Out
Question: Find the sums and differences:
(a) $\frac{3}{10}+3 \frac{4}{100}$
(b) $9 \frac{5}{10} \frac{7}{100}+2 \frac{1}{10} \frac{3}{100}$
(c) $15 \frac{6}{10} \frac{4}{100}+14 \frac{3}{10} \frac{6}{100}$
(d) $7 \frac{7}{100}-4 \frac{4}{100}$
(e) $8 \frac{6}{100}-5 \frac{3}{100}$
(f) $12 \frac{6}{100} \frac{2}{100}-\frac{9}{10} \frac{9}{100}$
Solution:
(a) $\frac{3}{10}+3 \frac{4}{100}$
$=\frac{30}{100}+3+\frac{4}{100}$
$=3+\left(\frac{30}{100}+\frac{4}{100}\right)$
$=3+\frac{34}{100}=3 \frac{34}{100}$
(b) $9 \frac{5}{10} \frac{7}{100}+2 \frac{1}{10} \frac{3}{100}$
$=(9+2)+\left(\frac{5}{10}+\frac{1}{10}\right)+\left(\frac{7}{100}+\frac{3}{100}\right)$
$=11+\left(\frac{5+1}{10}\right)+\left(\frac{7+3}{100}\right)$
$=11+\frac{6}{10}+\frac{10}{100}$
$=11+\frac{6}{10}+\frac{1}{10}=11+\frac{7}{10}=11 \frac{7}{10}$
(c) $15 \frac{6}{10} \frac{4}{100}+14 \frac{3}{10} \frac{6}{100}$
$=(15+14)+\left(\frac{6}{10}+\frac{3}{10}\right)+\left(\frac{4}{100}+\frac{6}{100}\right)$
$=29+\left(\frac{6+3}{10}\right)+\left(\frac{4+6}{100}\right)$
$=29+\frac{9}{10}+\frac{10}{100}$
$=29+\frac{9}{10}+\frac{1}{10}$
$=29+\frac{10}{10}=29+1=30$
(d) $7 \frac{7}{100}-4 \frac{4}{100}$
$=(7-4)+\left(\frac{7}{100}-\frac{4}{100}\right)$
$=3+\frac{3}{100}=3 \frac{3}{100}$
(e) $8 \frac{6}{100}-5 \frac{3}{100}$
$=(8-5)+\left(\frac{6}{100}-\frac{3}{100}\right)$
$=3+\frac{3}{100}=3 \frac{3}{100}$
(f) $12 \frac{6}{10} \frac{2}{100}-\frac{9}{10} \frac{9}{100}$
$=12 \frac{62}{100}-\frac{99}{100}$
$=11+1+\frac{62}{100}-\left(\frac{99}{100}\right)$
$=11+\frac{100}{100}+\frac{62}{100}-\left(\frac{99}{100}\right)$
$=11+\frac{162}{100}-\left(\frac{99}{100}\right)$
$=11+\left(\frac{162}{100}-\frac{99}{100}\right)$
$=11+\frac{63}{100}=11 \frac{63}{100}$
|
A Peek beyond the Point Class 7 Question Answers |
Figure it Out
Question 1: Find the sums
(a) 5.3 + 2.6
(b) 18 + 8.8
(c) 2.15 + 5.26
(d) 9.01 + 9.10
(e) 29.19 + 9.91
(f) 0.934 + 0.6
(g) 0.75 + 0.03
(h) 6.236 + 0.487
Solution:
(a) 5.3 + 2.6 = 7.9
(b) 18 + 8.8 = 26.8
(c) 2.15 + 5.26 = 7.41
(d) 9.01 + 9.10 = 18.11
(e) 29.19 + 9.91 = 39.10
(f) 0.934 + 0.6 = 1.534
(g) 0.75 + 0.03 = 0.78
(h) 6.236 + 0.487 = 6.723
Question 2: Find the differences
(a) 5.6 – 2.3
(b) 18 – 8.8
(c) 10.4 – 4.5
(d) 17 – 16.198
(e) 17 – 0.05
(f) 34.505 – 18.1
(g) 9.9 – 9.09
(h) 6.236 – 0.487
Solution:
(a) 5.6 – 2.3 = 3.3
(b) 18 – 8.8 = 9.2
(c) 10.4 – 4.5 = 5.9
(d) 17 – 16.198 = 0.802
(e) 17 – 0.05 = 16.95
(f) 34.505 – 18.1 = 16.405
(g) 9.9 – 9.09 = 0.81
(h) 6.236 – 0.487 = 5.749
| A Peek beyond the Point Class 7 Question Answers Page number: 78 Number of Questions: 16 |
Figure it Out
Question 1: Convert the following fractions into decimals:
(a) $\frac{5}{100}$ (b) $\frac{16}{1000}$ (c) $\frac{12}{10}$ (d) $\frac{254}{1000}$
Solution:
(a) $\frac{5}{100}$ = 0.05
(b) $\frac{16}{1000}$ = 0.016
(c) $\frac{12}{10}$ = 1.2
(d) $\frac{254}{1000}$ = 0.254
Question 2: Convert the following decimals into a sum of tenths, hundredths and thousandths:
(a) 0.34 (b) 1.02 (c) 0.8 (d) 0.362
Solution:
(a) $0.34=\left(3 \times \frac{1}{10}\right)+\left(4 \times \frac{1}{100}\right)=\frac{3}{10}+\frac{4}{100}$
(b) $1.02=(1 \times 1)+\left(2 \times \frac{1}{100}\right)=1+\frac{2}{100}$
(c) $0.8=\left(8 \times \frac{1}{10}\right)=\frac{8}{10}$
(d) $0.362=\left(3 \times \frac{1}{10}\right)+\left(6 \times \frac{1}{100}\right)+\left(2 \times \frac{1}{1000}\right)=\frac{3}{10}+\frac{6}{100}+\frac{2}{1000}$
Question 3: What decimal number does each letter represent in the number line below?
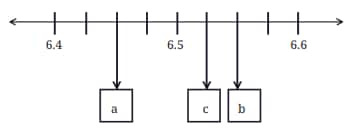
Solution:
Total divisions between 6.4 and 6.6 = 8
Each division = $\frac{6.6-6.4}{8}$ = $\frac{0.2}{8}$ = $\frac{2}{80}$ = 0.025
Therefore,
$a=6.4+(2 \times 0.025)=6.4+0.050=6.425$
$c=6.4+(5 \times 0.025)=6.4+0.125=6.525$
$b=6.4+(6 \times 0.025)=6.4+0.150=6.550$
Question 4: Arrange the following quantities in descending order:
(a) 11.01, 1.011, 1.101, 11.10, 1.01
(b) 2.567, 2.675, 2.768, 2.499, 2.698
(c) 4.678 g, 4.595 g, 4.600 g, 4.656 g, 4.666 g
(d) 33.13 m, 33.31 m, 33.133 m, 33.331 m, 33.313 m
Solution:
(a) $11.10>11.01>1.101>11.011>1.01$
(b) $2.768>2.698>2.675>2.567>2.499$
(c) $4.678 \mathrm{~g}>4.666 \mathrm{~g}>4.656 \mathrm{~g}>4.600 \mathrm{~g}>4.595 \mathrm{~g}$
(d) $33.331 \mathrm{~m}>33.313 \mathrm{~m}>33.31 \mathrm{~m}>33.133 \mathrm{~m}>33.13 \mathrm{~m}$
Question 5: Using the digits 1, 4, 0, 8, and 6, make:
(a) The decimal number closest to 30
(b) The smallest possible decimal number between 100 and 1000.
Solution:
(a) Possible numbers: 14.860,40.168
30 – 14.860 = 15.14
40.168 – 30 = 10.168
Therefore, 40.168 is the closest number to 30.
(b) The smallest possible decimal number between 100 and 1000 is 104.68.
Question 6: Will a decimal number with more digits be greater than a decimal number with fewer digits?
Solution:
Maybe, but not always. A number with more decimal digits can be smaller.
For Example:
0.12 has 2 decimal digits.
0.111 has 3 decimal digits.
But, 0.12 > 0.111
Question 7: Mahi purchases 0.25 kg of beans, 0.3 kg of carrots, 0.5 kg of potatoes, 0.2 kg of capsicums, and 0.05 kg of ginger. Calculate the total weight of the items she bought.
Solution:
Total weight = (0.25 + 0.3 + 0.5 + 0.2 + 0.05) kg = 1.3 kg
Question 8: Pinto supplies 3.79 L, 4.2 L, and 4.25 L of milk to a milk dairy in the first three days. In 6 days, he supplies 25 litres of milk. Find the total quantity of milk supplied to the dairy in the last three days.
Solution:
Milk supplied in first 3 days = (3.79 + 4.2 + 4.25) L = 12.24 L
Milk supplied in 6 days = 25 L
Therefore, Milk supplied in the last three days = (25 – 12.24) L = 12.76 L
Question 9: Tinku weighed 35.75 kg in January and 34.50 kg in February. Has he gained or lost weight? How much is the change?
Solution:
Since 35.75 > 34.50,
Therefore, he has lost weight.
Change in weight = (35.75 – 34.50) kg = 1.25 kg
So, Tinku has lost 1.25 kg.
Question 10: Extend the pattern: 5.5, 6.4, 6.39, 7.29, 7.28, 6.18, 6.17, ____, _____
Solution:
Pattern alternates: +0.9, –0.01, +0.9, –0.01, –1.1, –0.01,
Therefore, the next two terms are: 5.07 (–1.1), 5.06 (–0.01).
Question 11: How many millimetres make 1 kilometre?
Solution:
1 km = 1000 m = (1000 × 1000) mm = 10,00,000 mm.
Question 12: Indian Railways offers optional travel insurance for passengers who book e-tickets. It costs 45 paise per passenger. If 1 lakh people opt for insurance in a day, what is the total insurance fee paid?
Solution:
45 paise = Rs 0.45
1 lakh = 1,00,000
The total insurance fee paid = (1,00,000 × 0.45) = Rs. 45,000
Question 13: Which is greater?
(a) $\frac{10}{1000}$ or $\frac{1}{10}$?
(b) One-hundredth or 90 thousandths?
(c) One-thousandth or 90 hundredths?
Solution:
(a) $\frac{10}{1000}=\frac{1}{100}=0.01$
$\frac{1}{10}=0.1$
Since $0.01<0.1$
Therefore, $\frac{10}{1000}<\frac{1}{10}$
(b) One-hundredth $=\frac{1}{100}=0.01$
90 thousandths $=\frac{90}{1000}=\frac{9}{100}=0.09$
Since $0.01<0.09$
$\therefore$ One-hundredth $<$ 90 thousandths.
(c) One thousandth $=\frac{1}{1000}=0.001$
90 hundredths $=\frac{90}{100}=\frac{9}{10}=0.9$
Since $0.001<0.9$
$\therefore$ One-thousandth < 90 hundredths.
Question 14: Write the decimal forms of the quantities mentioned (an example is given):
(a) 87 ones, 5 tenths and 60 hundredths = 88.10
(b) 12 tens and 12 tenths
(c) 10 tens, 10 ones, 10 tenths, and 10 hundredths
(d) 25 tens, 25 ones, 25 tenths, and 25 hundredths
Solution:
(a) 87 ones, 5 tenths and 60 hundredths
$=(87 \times 1)+\left(5 \times \frac{1}{10}\right)+\left(60 \times \frac{1}{100}\right)$
$=87+\frac{5}{10}+\frac{6}{10}$
$=87+0.5+0.6=88.10$
(b) 12 tens and 12 tenths
$=(12 \times 10)+\left(12 \times \frac{1}{10}\right)$
$=120+\frac{12}{10}$
$=120+1.2=121.2$
(c) 10 tens, 10 ones, 10 tenths, and 10 hundredths
$\begin{aligned}
& =(10 \times 10)+(10 \times 1)+\left(10 \times \frac{1}{10}\right)+\left(10 \times \frac{1}{100}\right) \\
& =100+10+1+\frac{1}{10} \\
& =100+10+1+0.1 \\
& =111.1
\end{aligned}$
(d) 25 tens, 25 ones, 25 tenths, and 25 hundredths
$\begin{aligned}
& =(25 \times 10)+(25 \times 1)+\left(25 \times \frac{1}{10}\right)+\left(25 \times \frac{1}{100}\right) \\
& =250+25+\frac{25}{10}+\frac{25}{100} \\
& =250+25+2.5+0.25 \\
& =277.75
\end{aligned}$
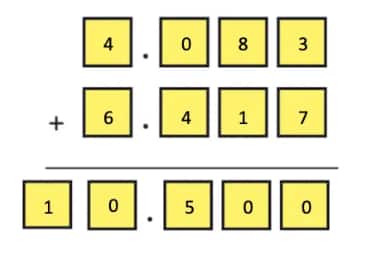
Question 15: Using each digit 0 – 9 not more than once, fill the boxes below so that the sum is closest to 10.5:
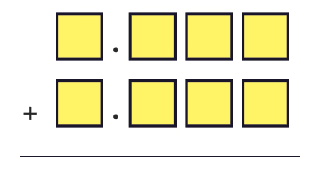
Solution:
Question 16: Write the following fractions in decimal form:
(a) $\frac{1}{2}$ (b) $\frac{3}{2}$ (c) $\frac{1}{4}$ (d) $\frac{3}{4}$ (e) $\frac{1}{5}$ (f) $\frac{4}{5}$
Solution:
(a) $\frac{1}{2}=\frac{1}{2} \times \frac{10}{10}=\frac{5}{10}=0.5$
(b) $\frac{3}{2} =\frac{3}{2} \times \frac{10}{10}=\frac{15}{10}=1.5$
(c) $\frac{1}{4} =\frac{1}{4} \times \frac{100}{100}=\frac{25}{100}=0.25$
(d) $\frac{3}{4} =\frac{3}{4} \times \frac{100}{100}=\frac{75}{100}=0.75$
(e) $\frac{1}{5} =\frac{1}{5} \times \frac{10}{10}=\frac{2}{10}=0.2$
(f) $\frac{4}{5} =\frac{4}{5} \times \frac{10}{10}=\frac{8}{10}=0.8$
A Peek beyond the Point Class 7 NCERT Solutions: Topics
Topics you will learn in NCERT Class 7 Maths Chapter 3 A Peek beyond the Point include:
- The Need for Smaller Units
- A Tenth Part
- A Hundredth Part
- Decimal Place Value
- Notation, Writing and Reading of Decimal Numbers
- Units of Measurement
- Locating and Comparing Decimals
- Addition and Subtraction of Decimals
- More on the Decimal System
Class 7 Maths Chapter 3 A Peek beyond the Point Solutions: Extra Question
Question:
Kushal went to a shop to buy fruits. The shopkeeper used a digital weighing machine that shows weights in kilograms and grams.
-
The weight of the apples he bought was 2.35 kg.
-
The weight of bananas was 1.7 kg.
-
The weight of the mangoes was 0.85 kg.
Now answer the following:
a) Write the weight of each fruit in words using decimal place value.
b) Convert the weight of bananas into grams. (Hint: 1 kg = 1000 g)
c) Arrange the weights of the fruits in ascending order.
Answer:
a)
2.35 kg = 2 kilograms, 3 tenths, and 5 hundredths
1.7 kg = 1 kilograms and 7 tenths
0.85 kg = 0 kg, 8 tenths, and 5 hundredths
b)
$1.7 \mathrm{~kg}=1.7 \times 1000=1700 \mathrm{~g}$
Hence, the correct answer is 1700 gm.
c)
Arranging the weights of fruits in ascending order, we get,
0.85 kg < 1.7 kg < 2.35 kg
NCERT Class 7 Maths Chapter 3 A Peek beyond the Point Notes
Careers360 has prepared these Class 7 A Peek beyond the Point Notes to make your revision smoother and faster. Additionally, these notes will help students to understand the A Peek beyond the Point NCERT solutions and solve them on their own from next time.
Addition and Subtraction of Fractions
When Denominators are the Same (Like Fractions)
-
Just add or subtract the numerators.
-
Keep the denominator the same.
Example:
$\frac{5}{12}+\frac{3}{12}=\frac{5+3}{12}=\frac{8}{12}=\frac{2}{3}$
$\frac{5}{12}-\frac{3}{12}=\frac{5-3}{12}=\frac{2}{12}=\frac{1}{6}$
When Denominators are Different (Unlike Fractions)
-
Find the LCM of denominators.
-
Convert both fractions to equivalent fractions with the same denominator.
-
Add or subtract the numerators.
Example:
$\frac34+\frac29$
LCM of 4 and $9=36$
Convert: $\frac{3}{4}=\frac{27}{36},\frac{2}{9}=\frac{8}{36}$
Add: $\frac{27}{36}+\frac{8}{36}=\frac{35}{36}$
Rule for Mixed Fractions
-
Convert them into improper fractions first.
-
Then follow the rules of addition/subtraction.
-
If needed, convert back into a mixed fraction.
Example:
$2 \frac{1}{3}+1 \frac{2}{5}$
Convert: $\frac{7}{3}+\frac{7}{5}$
LCM of 3 and $5=15$
$\frac{35}{15}+\frac{21}{15}=\frac{56}{15}=3 \frac{11}{15}$
Addition of Decimals
-
Write the numbers in columns (place value form).
-
Line up the decimal points.
-
Add zeros, if necessary, to make the number of decimal places equal.
-
-
Add as normal whole numbers from right to left.
-
Put the decimal point in the answer directly below the other decimal points.
Example:
7.58 + 2.60 = 10.18
Subtraction of Decimals
-
Write the numbers in columns, aligning decimal points.
-
Add zeros, if required, to make the decimal places equal.
-
Subtract as usual, starting from the rightmost digit.
-
Place the decimal point in the answer below the other points.
Example:
7.58 - 2.60 = 4.98
NCERT Solutions for Class 7 Maths Chapter Wise
We at Careers360 compiled all the NCERT class 7 Maths solutions in one place for easy student reference. The following links will allow you to access them.
NCERT Books and NCERT Syllabus
Students can also check the Class 7 NCERT Books and the NCERT Syllabus here:
Frequently Asked Questions (FAQs)
Q: How many exercises are there in Class 7 Maths NCERT Chapter 3, A Peek Beyond the Point and what do they include?
A:
NCERT Class 7 Maths Chapter 3 A Peek beyond the Point includes multiple in-text exercises involving reading decimal lengths on scales, writing decimals in fractional form, and performing addition and subtraction of decimals.
Q: Can I download free PDF of Class 7 Maths Chapter 3 Solutions A Peek Beyond the Point?
A:
Yes, a reliable platform like Careers360 offers free downloadable Class 7 Maths Chapter 3 Solutions in PDF format. These solutions are accurate and easy to understand as they are made by experienced subject matter experts.
Q: What examples from real life are used in NCERT Class 7 Maths Chapter 3 A Peek beyond the Point?
A:
Measurements like the lengths of screws, leaves, or fish illustrate why smaller units like tenths or hundredths are essential, helping learners link mathematics to the nature and objects around them.
Q: What are the main topics covered in A Peek beyond the Point Class 7 NCERT Solutions?
A:
The important topics that are covered in Class 7 Maths NCERT Chapter 3 A Peek Beyond the Point, are:
- The Need for Smaller Units
- A Tenth Part
- A Hundredth Part
- Decimal Place Value
- Notation, Writing and Reading of Decimal Numbers
- Units of Measurement
- Locating and Comparing Decimals
- Addition and Subtraction of Decimals
- More on the Decimal System
Q: How do NCERT Class 7 Maths Chapter 3 Solutions help with decimal place value concepts?
A:
A Peek beyond the Point Class 7 NCERT Solutions offer detailed, step-by-step explanations on identifying tenths, hundredths, and thousandths, and on comparing decimals accurately using number lines.
Articles
Upcoming School Exams

Popular Questions
A block of mass 0.50 kg is moving with a speed of 2.00 ms-1 on a smooth surface. It strikes another mass of 1.00 kg and then they move together as a single body. The energy loss during the collision is
| Option 1)
|
Option 2)
|
| Option 3)
|
Option 4)
|
An athlete in the olympic games covers a distance of 100 m in 10 s. His kinetic energy can be estimated to be in the range
| Option 1)
|
Option 2)
|
| Option 3)
|
Option 4)
|
A particle is projected at 600 to the horizontal with a kinetic energy . The kinetic energy at the highest point
| Option 1)
|
Option 2)
|
| Option 3)
|
Option 4)
|
In the reaction,
| Option 1)
|
Option 2)
|
| Option 3)
|
Option 4)
|
How many moles of magnesium phosphate, will contain 0.25 mole of oxygen atoms?
| Option 1)
0.02 |
Option 2)
3.125 × 10⁻² |
| Option 3)
1.25 × 10⁻² |
Option 4)
2.5 × 10⁻² |
Colleges After 12th
Courses After 12th
Applications for Admissions are open.
This ebook serves as a valuable study guide for NEET 2025 exam.
NEET Previous 10 Year Questions
Get nowThis e-book offers NEET PYQ and serves as an indispensable NEET study material.
JEE Main Important Physics formulas
Get nowAs per latest syllabus. Physics formulas, equations, & laws of class 11 & 12th chapters
JEE Main Important Chemistry formulas
Get nowAs per latest syllabus. Chemistry formulas, equations, & laws of class 11 & 12th chapters
JEE Main high scoring chapters and topics
Get nowAs per latest 2024 syllabus. Study 40% syllabus and score upto 100% marks in JEE
JEE Main Important Mathematics Formulas
Get nowAs per latest syllabus. Maths formulas, equations, & theorems of class 11 & 12th chapters