NEET/JEE Coaching Scholarship
ApplyGet up to 90% Scholarship on Offline NEET/JEE coaching from top Institutes
Data Handling Class 8 Questions And Answers provided here. These NCERT Solutions are created by expert team at craeers360 keeping the latest syllabus and pattern of CBSE 2023-23. In our daily life, we come across various types of data through the newspaper, television, social media which are related to many things like sports, economy, GDP, etc. Also, you must have seen these data are represented in the graphs, charts, and in the tabular form. Why we need data? What is the purpose of representing these data into a chart or in graph form?
In NCERT solutions for class 8 maths chapter 5 data handling, you will get answers to all these questions. Basically, the data is a collection of observations and information, while making important decisions, data is much helpful. Also, check NCERT class 8 solutions maths for maths and science subjects.
Data: A systematic record of facts or distinct values of a quantity.
Presentation of Data: Arranging data to study their salient features.
Frequency: The number of times a particular entity occurs in data.
Frequency Distribution Table: A table representing the frequency of different entities in the data.
Grouped Frequency Distribution Table: Data grouped into class intervals.
Class Size or Width: The number of values in each class interval.
Lower Class Limit: The lower value in a class interval.
Upper-class Limit: The upper value in a class interval.
Pictograph: Pictorial representation of data using symbols.
Bar Graph: A display of data using bars of uniform width, with heights proportional to values.
Double Bar Graph: A graph showing two sets of data simultaneously for comparison.
Histogram: A graphical representation of frequency distribution using rectangles with no gaps between them.
Circle Graph or Pie Chart: A representation of numerical data using proportional sectors in a circle.
Probability Formula: Probability = Number of outcomes making up an event / Total number of outcomes (assuming equally likely outcomes).
Free download NCERT Solutions for Class 8 Maths Chapter 5 Data Handling for CBSE Exam.
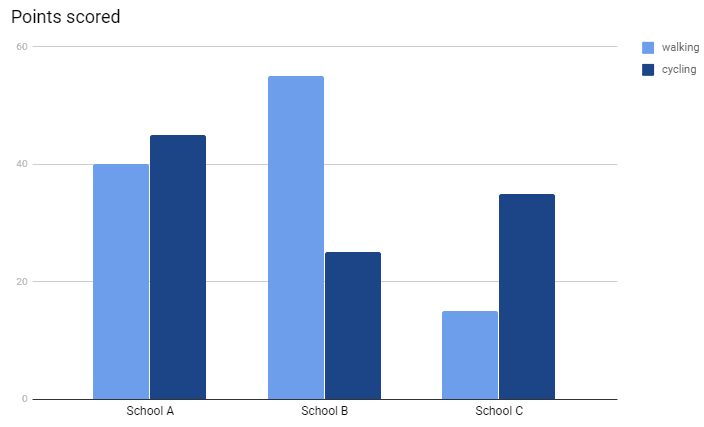
Q- Draw an appropriate graph to represent the given information.
Children Who prefer | School A | School B | School C |
Walking | 40 | 55 | 15 |
Cycling | 45 | 25 | 35 |
Answer:
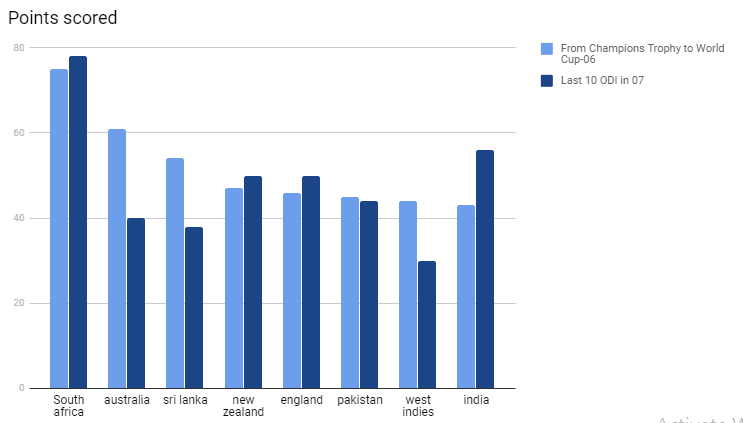
Q- Draw an appropriate graph to represent the given information
Percentage wins in ODI by 8 top cricket teams
Team | From Champions Trophy to World Cup-06 | Last 10 ODI in 07 |
South Africa | 75% | 78% |
Australia | 61% | 40% |
Sri Lanka | 54% | 38% |
New Zealand | 47% | 50% |
England | 46% | 50% |
Pakistan | 45% | 44% |
West Indis | 44% | 30% |
India | 43% | 56% |
Answer:
NCERT Class 8 Maths Solutions Chapter 5 - Organising Data
Q1 A group of students were asked to say which animal they would like most to have as a pet. The results are given below:
dog, cat, cat, fish, cat, rabbit, dog, cat, rabbit, dog, cat, dog, dog, dog, cat, cow, fish, rabbit, dog, cat, dog, cat, cat, dog, rabbit, cat, fish, dog. Make a frequency distribution table for the same.
Answer: The above data can be represented as shown below:
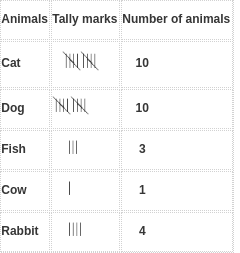
![]()
NCERT Class 8 Maths Solutions Chapter 5 - Grouping Data
Q1 Study the following frequency distribution table and answer the questions given below.
Frequency Distribution of Daily Income of 550 workers of a factory (Table 5.3)
Class Interval (Daily Income in Rs.) | Frequency (Number of workers) |
100-125 | 45 |
125-150 | 25 |
150-175 | 55 |
175-200 | 125 |
200-225 | 140 |
225-250 | 55 |
250-275 | 35 |
275-300 | 50 |
300-325 | 20 |
Total | 550 |
(i) What is the size of the class intervals?
Answer: (i) The size of the class intervals = 125-100 = 25
(ii) Which class has the highest frequency?
Answer: (ii) The class which has the highest frequency = 200-225 and the highest frequency is 140
(iii) Which class has the lowest frequency?
Answer: (iii) The class which has the lowest frequency = 300-325 and the lowest frequency is 20.
(iv) What is the upper limit of the class interval 250-275?
Answer: (iv) The upper limit of the class interval 250-275 is 275 and frequency is 35.
(v) Which two classes have the same frequency?
Answer: (v) The two classes which have the same frequency are 150-175 and 225-250 also the frequency is 55.
Q2 Construct a frequency distribution table for the data on weights (in kg) of 20 students of a class using intervals 30-35, 35-40 and so on.
40, 38, 33, 48, 60, 53, 31, 46, 34, 36, 49, 41, 55, 49, 65, 42, 44, 47, 38, 39
Answer: The frequency distribution table for the data given is :
Intervals | students |
30-35 | 3 |
35-40 | 5 |
40-45 | 3 |
45-50 | 5 |
50-55 | 2 |
55-60 | 1 |
60-65 | 1 |
total = 20 |
NCERT Class 8 Maths Solutions Chapter 5 - Bars With A Difference
Q1. Observe the histogram (Fig 5.3) and answer the questions given below.
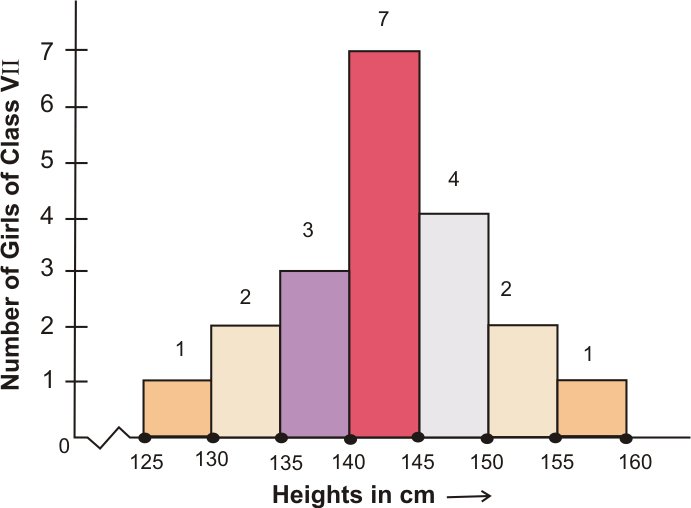
(i) What information is being given by the histogram?
Answer: The above histogram represents the number of girls as y-axis and heights in cm as x-axis.
(ii) Which group contains maximum girls?
Answer: The group which contains maximum girls is 140-145
(iiI) How many girls have a height of 145 cms and more?
Answer: The girls having a height of 145 cms and more are 4+2+1 = 7
(iv) If we divide the girls into the following three categories, how many would there be in each?
150 cms and more — Group A
140 cm to less than 150 cm — Group B
Less than 140 cm — Group C
Answer: 150 cms and more — Group A = 2+1 = 3
140 cm to less than 150 cm — Group B = 7+4 = 11
Less than 140 cm — Group C = 1+2+3 = 6
Class 8 maths chapter 5 NCERT solutions - Exercise: 5.1
Q1 For which of these would you use a histogram to show the data?
(a) The number of letters for different areas in a postman’s bag.
Answer: Histogram can be represented for the data which can be represented as a manner of intervals. The number of letters for different areas in a postman’s bag cannot be represented in form of interval so this cannot be represented using the histogram.
(b) The height of competitors in an athletics meet.
Answer: Histogram can be represented for the data which can be represented as a manner of intervals. The height of competitors in an athletics meet can be represented in form of interval so this can be represented using the histogram.
(c) The number of cassettes produced by 5 companies.
Histogram can be represented for the data which can be represented as a manner of intervals. The number of cassettes produced by 5 companies cannot be represented in form of interval so this cannot be represented using a histogram.
(d) The number of passengers boarding trains from 7 am to 7 pm at a station.
Answer: Histogram can be represented for the data which can be represented as a manner of intervals. The number of passengers boarding trains from 7 am to 7 pm at a station can be represented in form of interval so this can be represented using a histogram.
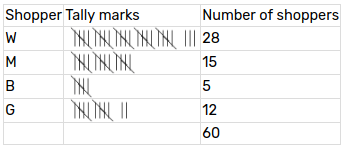
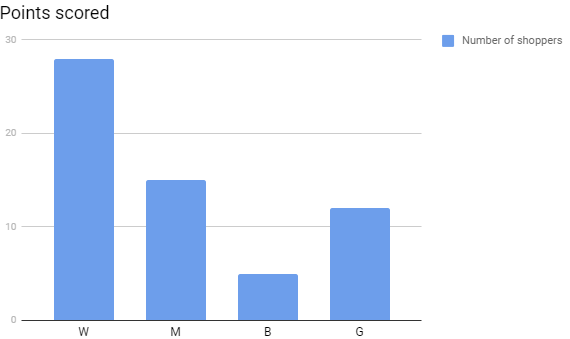
Q2 The shoppers who come to a departmental store are marked as: man (M), woman (W), boy (B) or girl (G). The following list gives the shoppers who came during the first hour in the morning:
Make a frequency distribution table using tally marks. Draw a bar graph to illustrate it.
Answer: The frequency distribution table using tally marks is as shown :
The graph is as shown below
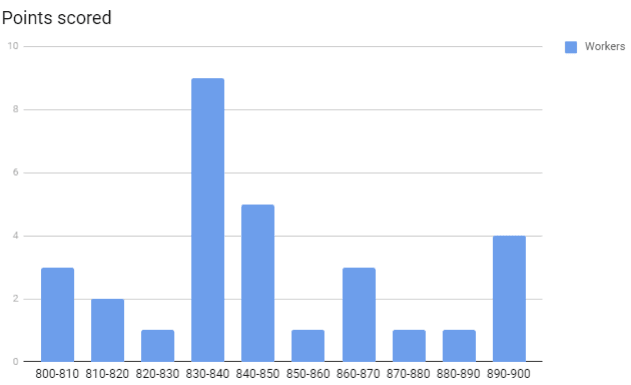
Q3 The weekly wages (in Rs) of 30 workers in a factory are.
830, 835, 890, 810, 835, 836, 869, 845, 898, 890, 820, 860, 832, 833, 855, 845, 804, 808, 812, 840, 885, 835, 836, 878, 840, 868, 890, 806, 840
Using tally marks make a frequency table with intervals as 800–810, 810–820 and so on.
Answer: Using tally marks a frequency table with intervals as 800–810, 810–820 and so on is as shown below:
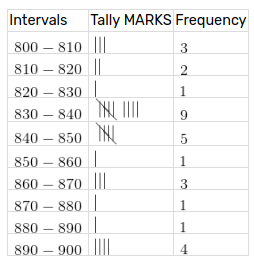
Q4 (i) Draw a histogram for the frequency table made for the data in Question 3, and answer the following questions.
830, 835, 890, 810, 835, 836, 869, 845, 898, 890, 820, 860, 832, 833, 855, 845, 804, 808, 812, 840, 885, 835, 836, 878, 840, 868, 890, 806, 840
Which group has the maximum number of workers?
Answer: (i) The group which has the maximum number of workers is 830-840
Q4 (ii) Draw a histogram for the frequency table made for the data in Question 3, and answer the following questions.
830, 835, 890, 810, 835, 836, 869, 845, 898, 890, 820, 860, 832, 833, 855, 845, 804, 808, 812, 840, 885, 835, 836, 878, 840, 868, 890, 806, 840
How many workers earn Rs. 850 and more?
Answer:
(ii) The workers earning Rs 850 and more are 1 + 3 + 1 +1 + 4 = 10

Q4 (iii) Draw a histogram for the frequency table made for the data in Question 3,and answer the following questions.
830, 835, 890, 810, 835, 836, 869, 845, 898, 890, 820, 860, 832, 833, 855, 845, 804, 808, 812, 840, 885, 835, 836, 878, 840, 868, 890, 806, 840
Q4 (iii) Draw a histogram for the frequency table made for the data in Question 3,and answer the following questions.
830, 835, 890, 810, 835, 836, 869, 845, 898, 890, 820, 860, 832, 833, 855, 845, 804, 808, 812, 840, 885, 835, 836, 878, 840, 868, 890, 806, 840
How many workers earn less than Rs 850
Answer: (iii) The workers earning less than RS 850 are 20 .
3 + 2 + 1 + 9 + 5 = 20
Q5 (i) The number of hours for which students of a particular class watched television during holidays is shown through the given graph. Answer the following.
For how many hours did the maximum number of students watch TV?

Answer: (i) From the graph we observed that the maximum number of students (32) watch TV for 4-5 hours.
Q5 (ii) The number of hours for which students of a particular class watched television during holidays is shown through the given graph. Answer the following.
How many students watched TV for less than 4 hours?

Answer: (ii) 34 students watched TV for less than 4 hours.
The number of students who watched TV for less than 4 hours = sum of the students who watched TV for (3–4hours) + (2–3hours) + (1–2hours.)
So, the total number of students = 4 + 8 + 22 = 34
Q5 (iii) The number of hours for which students of a particular class watched television during holidays is shown through the given graph. Answer the following.
How many students spent more than 5 hours in watching TV?
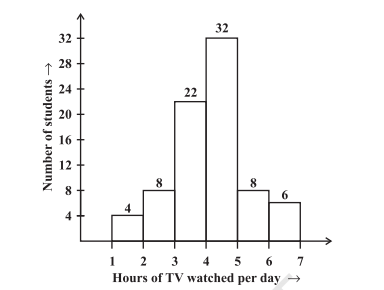
Answer: (iii) 14 students spent more than 5 hours in watching TV.
The number of students who watched TV for >5 hours = number of students who watched TV for (5 – 6 hours) + (6 – 7 hours).
So the no. of students = 8 + 6 = 14
NCERT Class 8 Maths Solutions Chapter 5 - Circle Graph or Pie Chart

Answer: 50% of the fraction of the circle represent girls and other 50% represent boys of class.
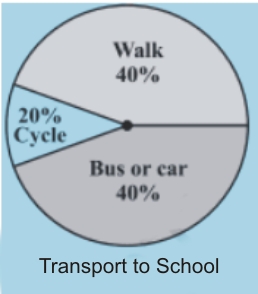
Answer: The circle represents that 20% students use cycle for transportation, 40% walk and 40% use bus or car for transportation.
Answer:
(iii)
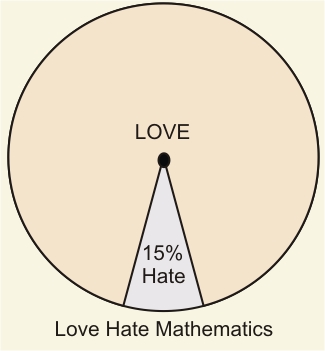
The circle represents that 85% students love and 15% students hate Mathematics.
Q2 (i) Answer the following questions based on the pie chart given (Fig 5.6 ).
Which type of programmes are viewed the most?
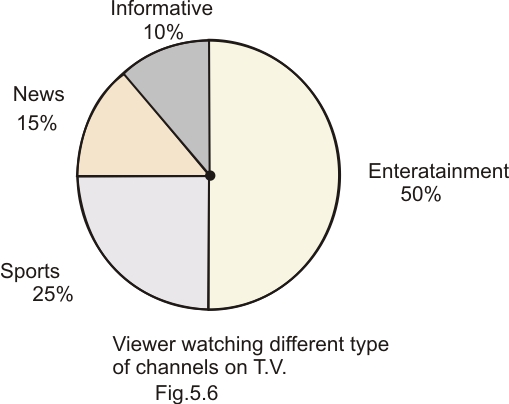
Answer:
(i) Entertainment programmes are viewed the most i.e.
Answer: Informative and News together have a number of viewers equal to those watching sports channels.
NCERT Class 8 Maths Solutions Chapter 5 - Drawing Pie Chart
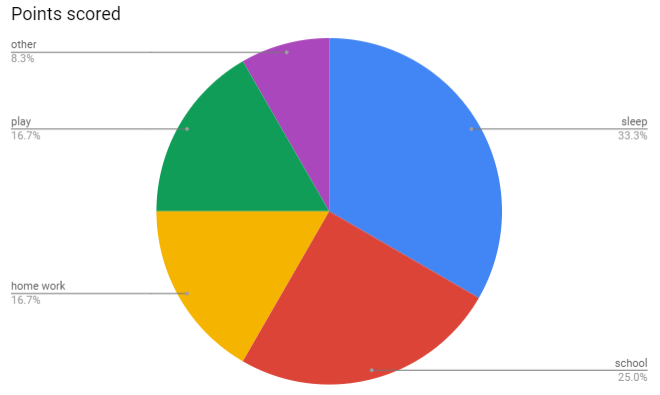
Q1 Draw a pie chart of the data given below.
The time spent by a child during a day.
Sleep — 8 hours
School — 6 hours
Homework — 4 hours
Play — 4 hours
Others — 2 hours
Answer: Pie chart of the data is given below:
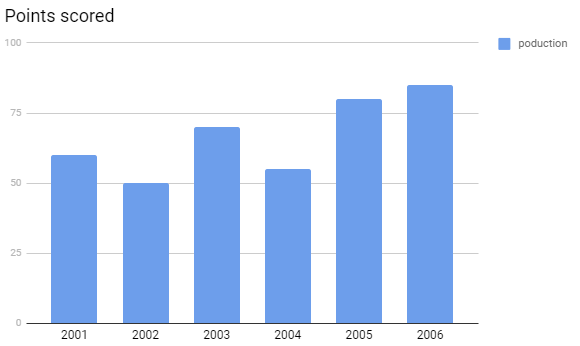
Q1 Which form of graph would be appropriate to display the following data.
Production of food grains of a state.
Year | 2001 | 2002 | 2003 | 2004 | 2005 | 2006 |
Production (in lakh tons) | 60 | 50 | 70 | 55 | 80 | 85 |
Answer: Data can be represented as shown below as bar graph.
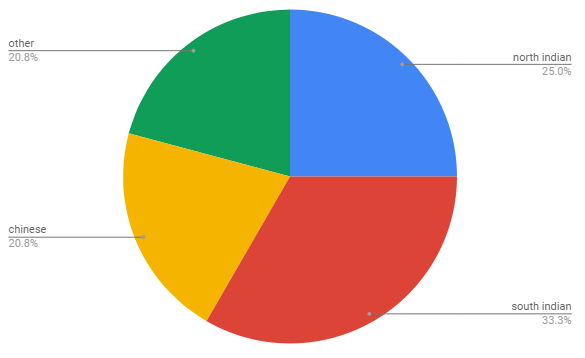
Q2 Which form of graph would be appropriate to display the following data.
Choice of food for a group of people.
Favourite food | Number of people |
North Indian | 30 |
South Indian | 40 |
Chinese | 25 |
Others | 25 |
Total | 120 |
Answer: The given data can be represented as shown below as pie chart.
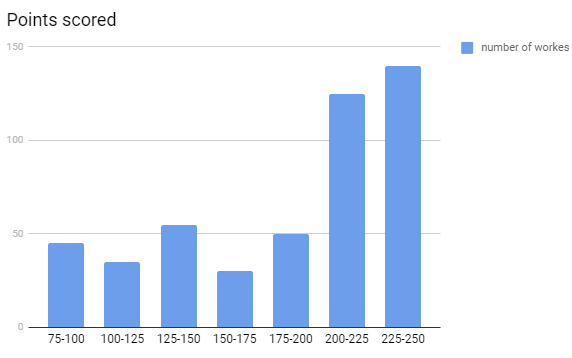
Q3 Which form of graph would be appropriate to display the following data.
The daily income of a group of factory workers
Daily Income (in Rupees) | Number of workers (In a factory) |
75-100 | 45 |
100-125 | 35 |
125-150 | 55 |
150-175 | 30 |
175-200 | 50 |
200-225 | 125 |
225-250 | 140 |
Total | 480 |
Answer:
The data can be represented as shown below as bar graph.
Class 8 data handling NCERT solutions - Exercise: 5.2
(i) If 20 people liked classical music, how many young people were surveyed?
(ii) Which type of music is liked by the maximum number of people?
(iii) If a cassette company were to make 1000 CD’s, how many of each type would they make?

Answer:
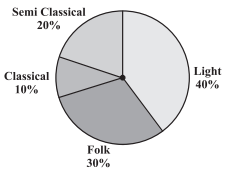
(i)If 20 people liked classical music
Total number of people =
(ii) Maximum number of people light music i.e.
(iii) If a cassette company were to make 1000 CD’s, then
Light music CD's =
Folk music CD's =
Classical music CD's =
Semi classical music CD's =

![]()
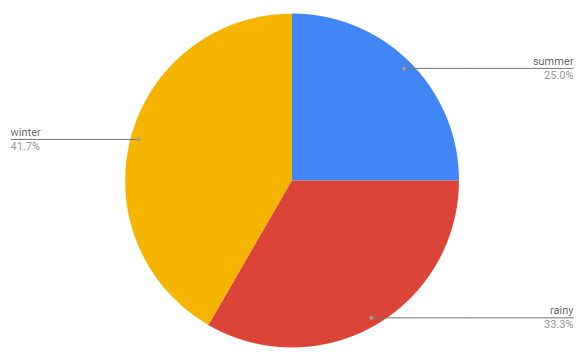
(i) Which season got the most votes?
(ii) Find the central angle of each sector.
(iii) Draw a pie chart to show this information.
Answer:
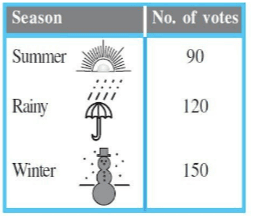
![]()
(i) Winter season got the most votes.
(ii) Total Votes = 90+120+150 = 360
central angle of summer =
central angle of rainy =
central angle of winter =
(iii)
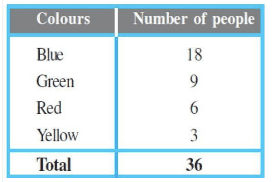
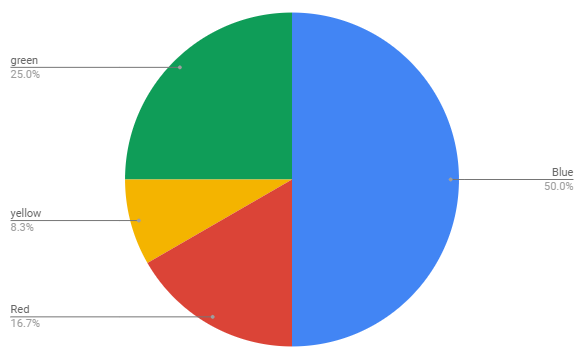
Q3 Draw a pie chart showing the following information.
The table shows the colours preferred by a group of people.

![]()
Answer:
![]()
colours | number of people | in fraction | central angles |
Blue | 18 | ||
Green | 9 | ||
Red | 6 | ||
Yellow | 3 |
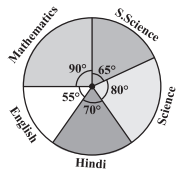
(i) In which subject did the student score 105 marks?
( Hint: for
Answer:
subject | central angle | marks obtained |
mathematics | ||
science | ||
social science | ||
english | ||
hindi |
(i) In hindi subject the student score 105 marks.
How many more marks were obtained by the student in Mathematics than in Hindi?

Answer:
subject | central angle | marks obtained |
mathematics | ||
science | ||
social science | ||
english | ||
hindi |
(ii)
Hence, 30 more marks were obtained by the student in Mathematics than in Hindi.
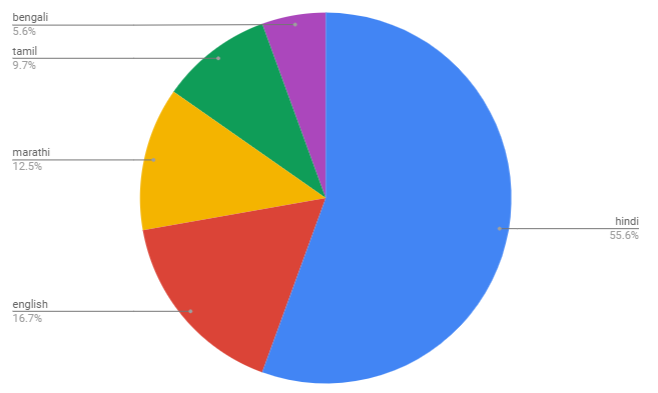
Q4 The adjoining pie chart gives the marks scored in an examination by a student in Hindi, English, Mathematics, Social Science and Science. If the total marks obtained by the students were 540, answer the following questions.
(Hint: Just study the central angles).

Answer:
subject | central angle | marks obtained |
mathematics | ||
science | ||
social science | ||
english | ||
hindi |
(iii) the sum of the marks obtained in Social Science and Mathematics =
the sum of the marks obtained in Science and Hindi =
Yes, the sum of the marks obtained in Social Science and Mathematics is more than that in Science and Hindi.

Answer:
The pie chart is as shown below:
NCERT Class 8 Maths Solutions Chapter 5 Practise: Getting A Result
Q1 If you try to start a scooter, what are the possible outcomes?
Answer:
1.If you try to start a scooter,then there are two possibilities.
(i) . The scooter will start.
(ii) . The scooter will not start.
Q2 When a die is thrown, what are the six possible outcomes?
Answer:
2. When a die is thrown, the six possible outcomes are :
(i) 1
(ii) 2
(iii) 3
(iv) 4
(v) 5
(vi) 6
Q3 When you spin the wheel shown, what are the possible outcomes? (Fig 5.9) List them.
(Outcome here means the sector at which the pointer stops).
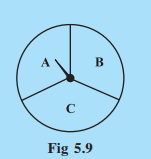
Answer: 3. When we spin the wheel shown, the possible outcomes are:
(i) A
(ii) B
(iii) C

![]()
Fig 5.10
Answer:
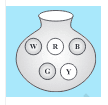
![]()
Fig 5.10
The possible outcomes are:
(i) W
(ii) R
(iii) B
(iv) G
(v) Y
Q5 In throwing a die:
Does the first player have a greater chance of getting a six?
Would the player who played after him have a lesser chance of getting a six?
Suppose the second player got a six. Does it mean that the third player would not have a chance of getting a six?
Answer: In throwing a die:
No, the first player also have same chance of getting a six.
No, the player who played after him have same chance of getting a six.
Suppose the second player got a six.It does not mean that the third player would not have a chance of getting a six. Third person also have same chance of getting six.
NCERT Class 8 Maths Solutions Chapter 5 - Excercise: Linking Chances of Probablity
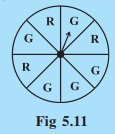
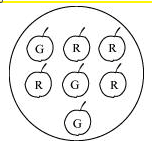
Suppose you spin the wheel

Answer:

(i) the number of outcomes of getting a green sector = 5
the number of outcomes of not getting a green sector = 3
Q1 (ii) Suppose you spin the wheel Find the probability of getting a green sector.
. 
Answer:

(ii) the probability of getting a green sector = 5/8 = 0.625
Q1 (iii) Suppose you spin the wheel Find the probability of not getting a green sector.

Answer: (iii) the probability of not getting a green sector =
Class 8 maths chapter 5 question answer - Exercise: 5.3
Q1 (a) List the outcomes you can see in these experiments. Spinning a wheel

Answer:
(a) the outcomes you can see in these experiments are:

(i) A
(ii) B
(iii) C
(iv) D
Q1 (b) List the outcomes you can see in these experiments Tossing two coins together
Answer: (b)The outcomes you can see in the experiments Tossing two coins together are :
(i) Head
(ii) tail
Q2 When a die is thrown, list the outcomes of an event of getting
(i) (a) a prime number (b) not a prime number.
(ii) (a) a number greater than
Answer: When a die is thrown, the outcomes of an event of getting
(i) (a) a prime number are 2,3,5.
(b) not a prime number are 1,4,6.
(ii) (a) a number greater than 5 is 6.
(b) a number not greater than 5 are1,2,3,4,5.
Q3 (a) Find the Probability of the pointer stopping on D in (Question 1-(a))?

Answer: (a) Probability of the pointer stopping on D

Q3 (b) Find the Probability of getting an ace from a well-shuffled deck of 52 playing cards?
Answer: (b) Probability of getting an ace from a well-shuffled deck of 52 playing cards
Q3 (c) Find the Probability of getting a red apple. (See figure below)

![]()
Answer:
(c) Probability of getting a red apple
![]()
(i) getting a number 6?
(ii) getting a number less than 6?
(iii) getting a number greater than 6?
(iv) getting a 1-digit number?
Answer:
(i) the probability of getting a number
(ii) the numbers less than 6 are: 1,2,3,4,5=5 numbers.
the probability of getting a number less than
(iii) the numbers greater than 6 are: 7,8,9,10=4 numbers.
the probability of getting a number greater than
(iv) 1 digit numbers = 1,2,3,4,5,6,7,8,9 = 9 numbers
the probability of getting a 1 digit number
Answer:
Total sectors = 5
probability of getting a non blue sector
Q6 Find the probabilities of the events given in Question 2.
When a die is thrown, list the outcomes of an event of getting
(i) (a) a prime number
(b) not a prime number.
(ii) (a) a number greater than 5
(b) a number not greater than 5.
Answer:
Total outcomes = 6
6.(i) (a) prime numbers = 2,3,5 = 3 numbers
probability of prime number
(b) non prime numbers = 1,4,6 = 3 numbers
probability of non prime number
(ii) (a) number greater than 5 = 6 = 1 number only
probability of getting number greater than 5
(b) number not greater than 5 = 1,2,3,4,5 = 5 numbers.
probability of getting number not greater than 5
In NCERT solutions class 8 maths chapter 5, you will learn the data representation in an organized form so that its interpretation and analysis can become easier. By referring to NCERT solutions for class 8 maths chapter 5, you will get to know about types of graphs and charts to represent data and some are listed below.
Tabular Chart - The most simple form of data presentation is Tabular chart where data is always represented in matrix form which is most easy to the readable form of data representation. Tabular Chart example is given below for students’ reference.
Pie Chart - NCERT class 8 maths solutions chapter 5 says that a pie chart is a chart where the data is represented either in the form of percentages or as angles made in the middle by that particular sector of the circle.
Bar Graph - As per NCERT solutions for class 8 maths chapter 5, the bar graph is the most preferred method of data representation where data is always represented in bars and multiple bars.
Line Graph - Line Graph is an integral part of NCERT 8th class maths solutions chapter 5 data handling. It is an extended and updated version of Bar Graph where the top of every bar is connected to the next bar’s top and the adjoining of these tops makes a line graph.
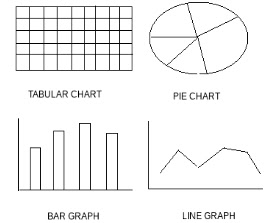
There are many questions in the NCERT solutions for class 8 maths chapter 5 data handling, in which you will get to know about the use of different types of graphs for different types of data based on the need. There are 3 exercises with 16 questions in chapter 5 of NCERT class 8 maths solutions. You will get detailed explanations of these questions in the NCERT solutions for class 8 maths chapter 5 data handling.
Chapter -1 | |
Chapter -2 | |
Chapter-3 | |
Chapter-4 | |
Chapter-5 | Data Handling |
Chapter-6 | |
Chapter-7 | |
Chapter-8 | |
Chapter-9 | |
Chapter-10 | |
Chapter-11 | |
Chapter-12 | |
Chapter-13 | |
Chapter-14 | |
Chapter-15 | |
Chapter-16 |
There are some important terms and formulas used in the class 8 maths ch 5 question answer which are listed below.
There are many questions given after every topic. To make a grip on this topic, you should example, practice questions are given after every topic, and exercise questions by your self. If you finding difficulties you can take help from the NCERT solutions for class 8 maths chapter 5 data handling.
Organizing and grouping data, bar charts, pie charts, probability are the important topics of this chapter.
CBSE class 8 maths is a basic and very simple maths where most of the topics related to the previous classes.
Here you will get the detailed NCERT solutions for class 8 by clicking on the link.
Here you will get the detailed NCERT solutions for class 8 maths by clicking on the link.
There are 16 chapters starting from rational number to playing with numbers in the CBSE class 8 maths.
NCERT official is the official website of the NCERT where you can get NCERT textbooks and syllabus from class 1 to 12.
Admit Card Date:03 February,2025 - 04 April,2025
Application Date:01 March,2025 - 06 April,2025
Admit Card Date:07 March,2025 - 04 April,2025
Admit Card Date:10 March,2025 - 05 April,2025
A block of mass 0.50 kg is moving with a speed of 2.00 ms-1 on a smooth surface. It strikes another mass of 1.00 kg and then they move together as a single body. The energy loss during the collision is
| Option 1)
|
Option 2)
|
| Option 3)
|
Option 4)
|
An athlete in the olympic games covers a distance of 100 m in 10 s. His kinetic energy can be estimated to be in the range
| Option 1)
|
Option 2)
|
| Option 3)
|
Option 4)
|
A particle is projected at 600 to the horizontal with a kinetic energy . The kinetic energy at the highest point
| Option 1)
|
Option 2)
|
| Option 3)
|
Option 4)
|
In the reaction,
| Option 1)
|
Option 2)
|
| Option 3)
|
Option 4)
|
How many moles of magnesium phosphate, will contain 0.25 mole of oxygen atoms?
| Option 1)
0.02 |
Option 2)
3.125 × 10⁻² |
| Option 3)
1.25 × 10⁻² |
Option 4)
2.5 × 10⁻² |

Get up to 90% Scholarship on Offline NEET/JEE coaching from top Institutes

This ebook serves as a valuable study guide for NEET 2025 exam.

This e-book offers NEET PYQ and serves as an indispensable NEET study material.

As per latest 2024 syllabus. Physics formulas, equations, & laws of class 11 & 12th chapters
As per latest 2024 syllabus. Chemistry formulas, equations, & laws of class 11 & 12th chapters
Accepted by more than 11,000 universities in over 150 countries worldwide

Student Community: Where Questions Find Answers