

NCERT Solutions for Class 8 Maths Chapter 4 - Quadrilaterals
In the world of geometry, quadrilaterals are the stepping stones to higher learning. Quadrilaterals are all around us in everyday life, on doors, windows, TV screens, Kites, blackboards, etc. In this NCERT Class 8 Maths Chapter 4 Quadrilaterals, students will learn about different types of four-sided shapes, including rectangles, squares, kites and trapeziums, together with their special angles and properties. Learning about Quadrilaterals and their types will not only help students in class 8 but also in higher classes and competitive exams. These NCERT Solutions for Class 8 Maths can be considered essential study material for both practice and revision.
This Story also Contains
- NCERT Solutions for Class 8 Maths Chapter 4 Quadrilaterals: Download Free PDF
- NCERT Solutions for Class 8 Maths Chapter 4: Exercise Questions
- Quadrilaterals Class 8 Chapter 4 Solutions: Topics
- Class 8 Maths Chapter 4 Quadrilaterals Solutions: Extra Questions
- NCERT Solutions for Class 8 Maths Chapter 4 Quadrilaterals: Notes
- NCERT Solutions for Class 8 Maths Chapter 4 Quadrilaterals: Important Formulae
- Why are Class 8 Maths Chapter 4 Quadrilaterals Question Answers Important?
- NCERT Solutions for Class 8 Mathematics Chapter Wise
- NCERT Books and NCERT Syllabus
This chapter is not entirely about drawing shapes, but about how they behave. Subject matter experts at Careers360 created these trustworthy and reliable NCERT Solutions for Class 8, making them an essential resource for exam preparation. Many toppers rely on NCERT Solutions because they are designed in accordance with the latest syllabus. These solutions give clear, step-by-step answers to all the questions in a way that makes learning easier for students.
NCERT Solutions for Class 8 Maths Chapter 4 Quadrilaterals: Download Free PDF
Careers360 brings you NCERT Class 8 Maths Chapter 4 Quadrilaterals solutions, carefully prepared by subject experts to simplify your studies and help in exams. Click the link below to download and access the Class 8 Maths Chapter 4 Quadrilaterals Solutions PDF easily.
NCERT Solutions for Class 8 Maths Chapter 4: Exercise Questions
Here are the NCERT Class 8 Maths Chapter 4 Quadrilaterals question answers with clear and detailed solutions.
|
Quadrilaterals Class 8 Question answers Figure it Out Number of Questions: 5 Page number: 94 |
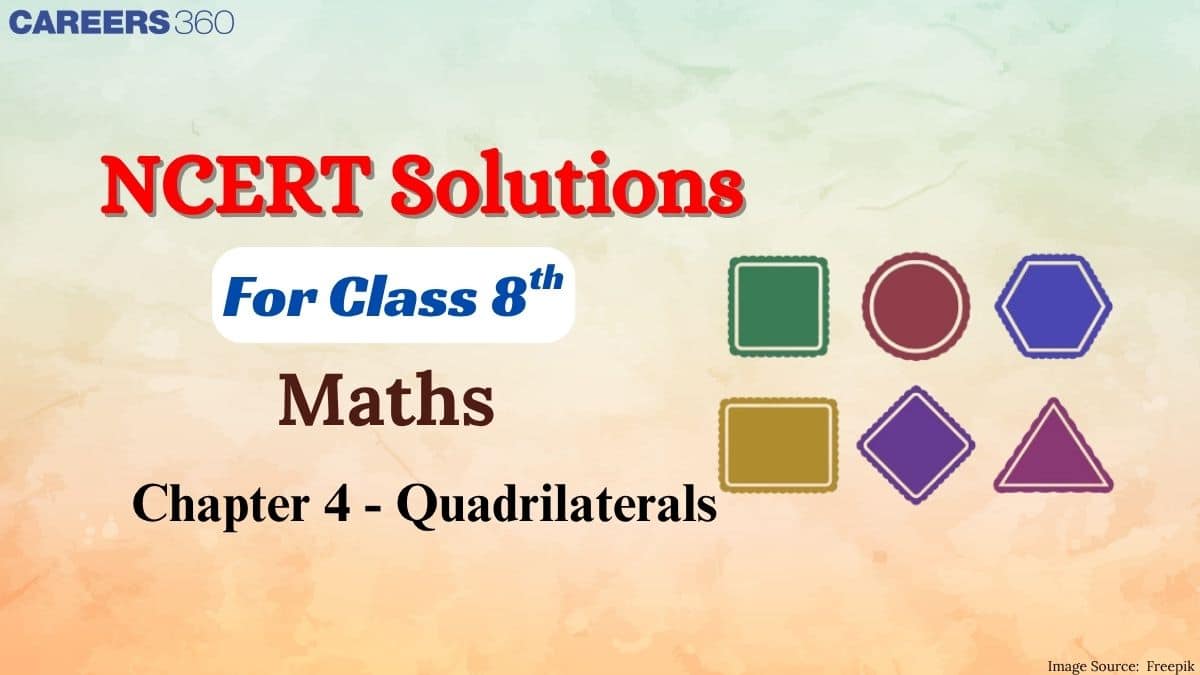
Question 1. Find all the other angles inside the following rectangles.
Answer:
(i)
In the rectangle ABCD, $\angle$A = $\angle$B = $\angle$C = $\angle$D = 90°
Also, $\angle$CAB = $\angle$ACD [Alternate interior angle]
and $\angle$CAD = $\angle$ACB [Alternate interior angle]
Here, $\angle$CAB = 90° [Given]
$\therefore$ $\angle$ACD = 90°
So, $\angle$CAD = 90° - 30° = 60° = $\angle$ACB
(ii)
In the rectangle PQRS, let the midpoint be O.
$\angle$ROQ = 110°
We know that vertical angles are equal and supplementary to their adjacent angles.
So, $\angle$ROQ = 110° = $\angle$POS
Also, $\angle$ROQ + $\angle$SOR = 180° [Supplementary angle]
⇒ 110° + $\angle$SOR = 180°
⇒ $\angle$SOR = 70°
Also, $\angle$POQ = 70° [$\because \angle$SOR = $\angle$POQ
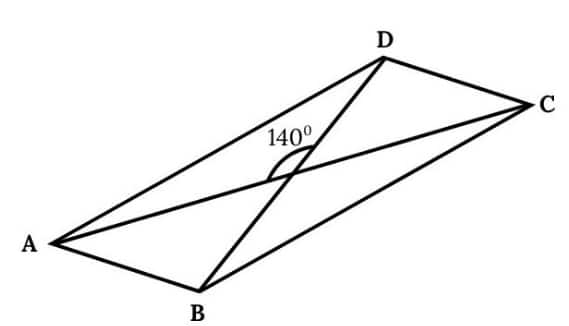
Question 2. Draw a quadrilateral whose diagonals have equal lengths of 8 cm that bisect each other, and intersect at an angle of
(i) 30° (ii) 40° (iii) 90° (iv) 140°
Answer:
(i)
(ii)
(iii)
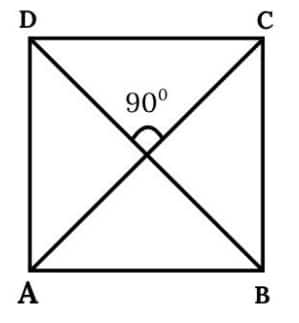
(iv)
Question 3. Consider a circle with centre O. Line segments PL and AM are two perpendicular diameters of the circle. What is the figure APML? Reason and/or experiment to figure this out.
Answer:
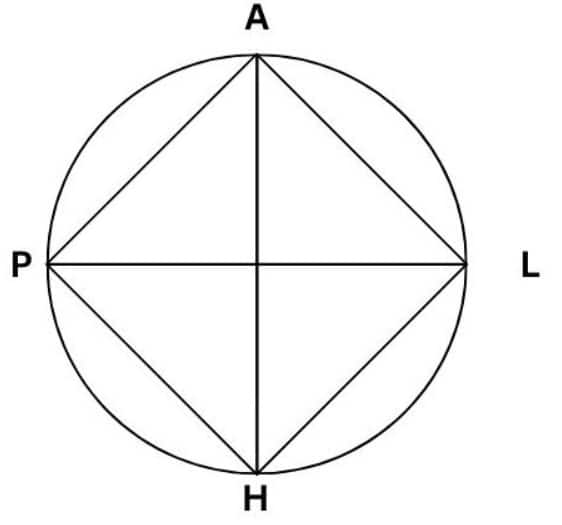
All four sides are equal in length. ($\because$ they are chords of the same radius)
Each interior angle is 90°, because the angle between two perpendicular diameters is 90°, and adjacent sides are at right angles.
So, APML is a Square.
Question 4. We have seen how to get 90° using paper folding. Now, suppose we do not have any paper but two sticks of equal length and a thread. How do we make an exact 90° angle using these?
Answer:
We have to tie the two sticks together at one end so that they can rotate like a hinge.
Then we have to cut a thread of length 12 units (for example, 12 cm ) and tie its ends to the free ends of the two sticks.
After that, we have to mark the thread into segments of 3 units, 4 units, and 5 units.
We will form a triangle with the thread:
- Keep the 3-unit side along one stick.
- Keep the 4-unit side along the other stick.
- The 5-unit side will naturally form the hypotenuse.
By the Pythagoras theorem $\left(3^2+4^2=5^2\right)$, the angle between the sticks will be exactly $90^{\circ}$.
Question 5. We saw that one of the properties of a rectangle is that its opposite sides are parallel. Can this be chosen as a definition of a rectangle? In other words, is every quadrilateral that has opposite sides parallel and equal a rectangle?
Answer:
No, this cannot be the definition of a rectangle because a rectangle always has all angles that are 90°.
For example:
A rhombus or a parallelogram has opposite sides parallel and equal.
But if its angles are not 90°, it is not a rectangle.
|
Quadrilaterals Class 8 Question answers Figure it Out Number of Questions: 3 Page number: 102 |
Question 1. Find the remaining angles in the following quadrilaterals.
![]()
Answer:
(i) Quadrilateral PRAE
It is a parallelogram (opposite sides are parallel).
In a parallelogram:
1. Opposite angles are equal.
2. Adjacent angles are supplementary (sum $=180^{\circ}$ ).
Given: $\angle P=40^{\circ}$
$\angle A=\angle P=40^{\circ}$ (opposite angles are equal).
$\angle E=180^{\circ}-40^{\circ}=140^{\circ}$ (adjacent angles are supplementary).
$\angle E=\angle R=140^{\circ}$.
(ii) Quadrilateral PSRQ
It is a parallelogram (opposite sides are parallel).
Given: $\angle P=110^{\circ}$
$\angle R=\angle P=110^{\circ}$ (opposite angles are equal).
$\angle S=180^{\circ}-110^{\circ}=70^{\circ}$ (adjacent angles are supplementary).
$\angle Q=\angle S=70^{\circ}$
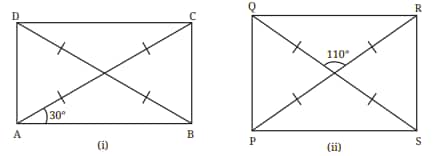
(iii)
Quadrilateral UVWX
It is a parallelogram (opposite sides are parallel).
$\angle$UVX = 30°
Then, $\angle$UXV = 30°
So, $\angle$XUV = 180° - 30° -30° = 120°
Also, $\angle$XWV = 120° [Opposite angles are equal]
Then, $\angle$UXW = 180° - 120° = 60° = $\angle$UVW
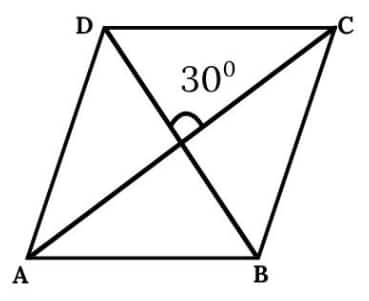
(iv)
Quadrilateral AEIO
It is a parallelogram (opposite sides are parallel).
$\angle$AEO = 20°
Then, $\angle$AOE = 20°
So, $\angle$OAE = 180° - 20° - 20° = 140°
Also, $\angle$OIE = 140° [Opposite angles are equal]
Then, $\angle$AOI = 180° - 140° = 40° = $\angle$AEI
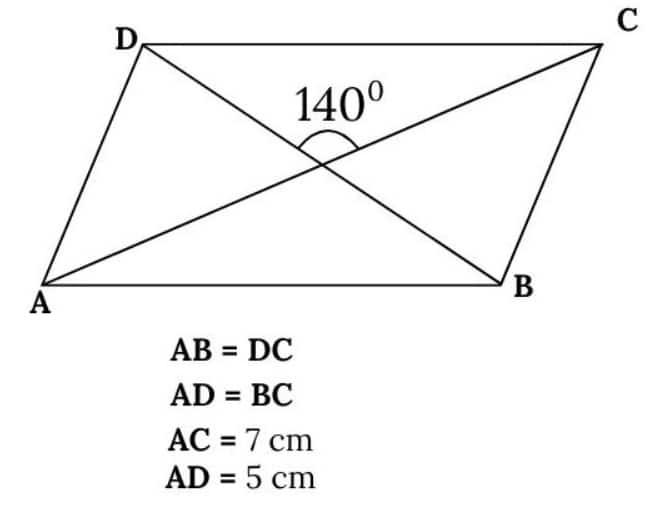
Question 2. Using the diagonal properties, construct a parallelogram whose diagonals are of lengths 7 cm and 5 cm, and intersect at an angle of 140°.
Answer:
Question 3. Using the diagonal properties, construct a rhombus whose diagonals are of lengths 4 cm and 5 cm.
Answer:
|
Quadrilaterals Class 8 Question answers Figure it Out Number of Questions: 11 Page number: 107-109 |
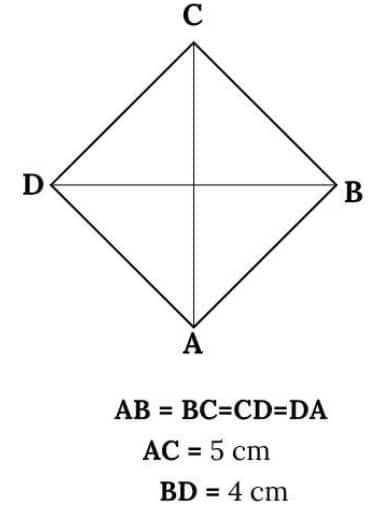
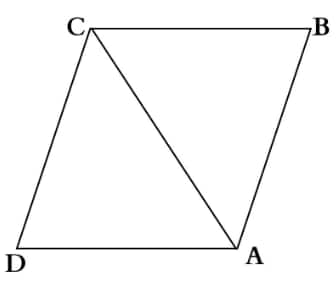
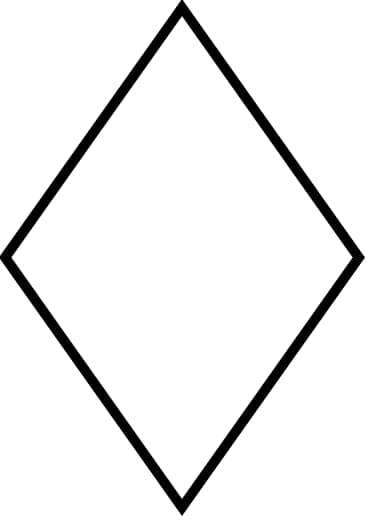
Question 1. Find all the sides and the angles of the quadrilateral obtained by joining two equilateral triangles with sides 4 cm.
Answer:
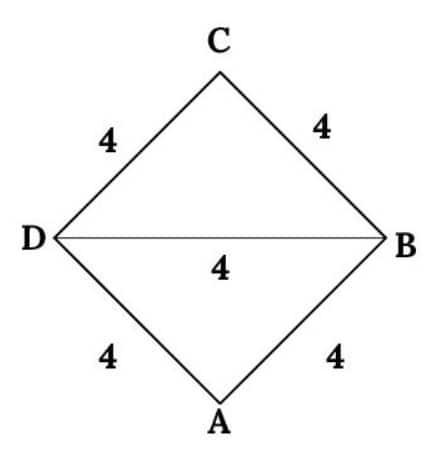
Here, the two equilateral triangles, $\triangle$ABD and $\triangle$CBD, share one common side of 4 cm.
Imagine triangle ABC and triangle CBD, both equilateral triangles with a side of 4 cm, and BC is the common side.
So, all sides of the Quadrilateral ABCD are 4 cm.
I.e., AB = BC = CD = DA = 4 cm
Since all triangles are equilateral, each angle is $60^{\circ}$.
So, $\angle \mathrm{A}=\angle \mathrm{D}=60^{\circ}$
The angle at B is made of two $60^{\circ}$ angles from each triangle.
So, $\angle \mathrm{B}=120^{\circ}$
Similarly, $\angle \mathrm{D}=120^{\circ}$
ABCD is a rhombus.
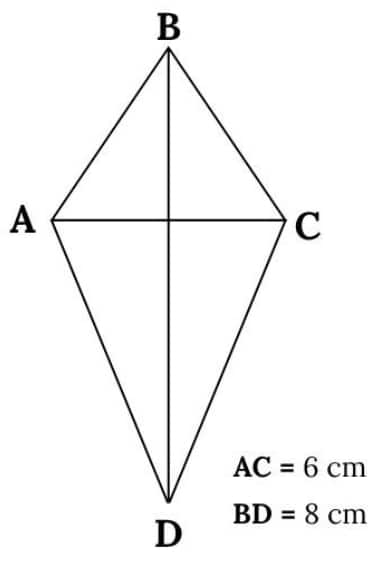
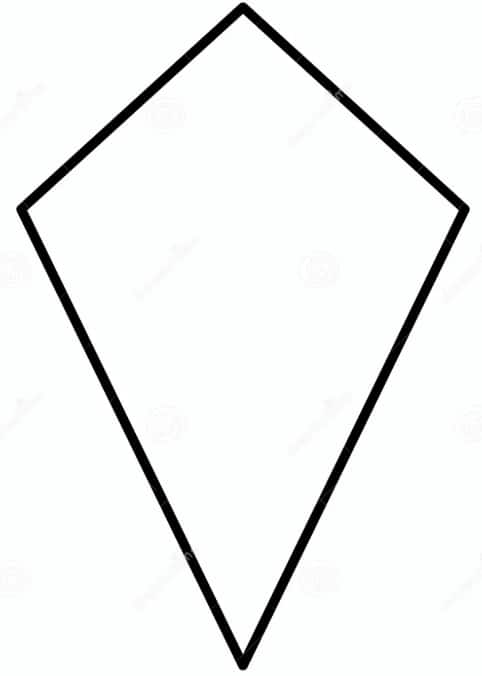
Question 2. Construct a kite whose diagonals are of lengths 6 cm and 8 cm.
Answer:
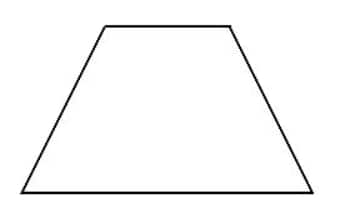
Question 3. Find the remaining angles in the following trapeziums—
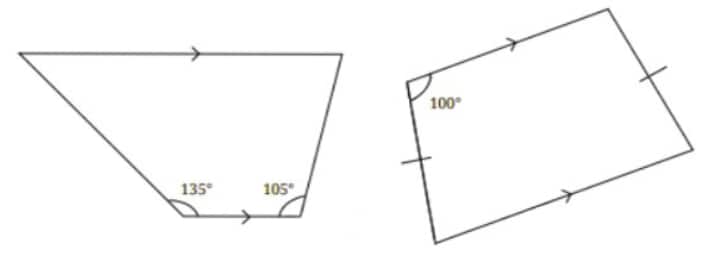
Answer:
We know that in a Trapezium, the adjacent interior angles sum up to 180°.
(i)

In Trapezium ABCD, $\angle$DAB = 135° and $\angle$ABC = 105° [Given]
Now, $\angle$DAB + $\angle$ ADC = 180°
⇒ $\angle$ADC = 180° - $\angle$DAB = 180° - 135° = 45°
Also, $\angle$BCD + $\angle$ABC = 180°
⇒ $\angle$BCD = 180° - $\angle$ABC = 180° - 105° = 75°
(ii)
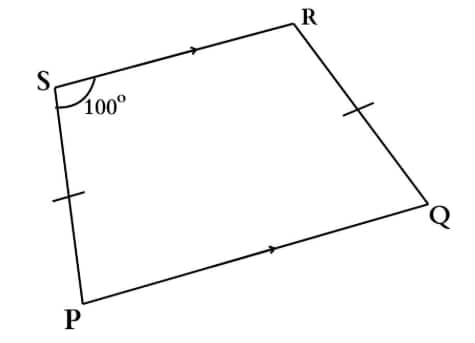
It is an isosceles trapezium as the non-parallel sides, PS and QR, are equal, and the base angles are equal.
$\angle$PSR = 100°
So, the opposite base angle is also $100^{\circ}$.
The angles adjacent to each of those (on the same side of the legs) are:
$100^{\circ}+\angle$PSR $=180^{\circ}$
$⇒\angle$PSR $=80^{\circ}=\angle$SPQ
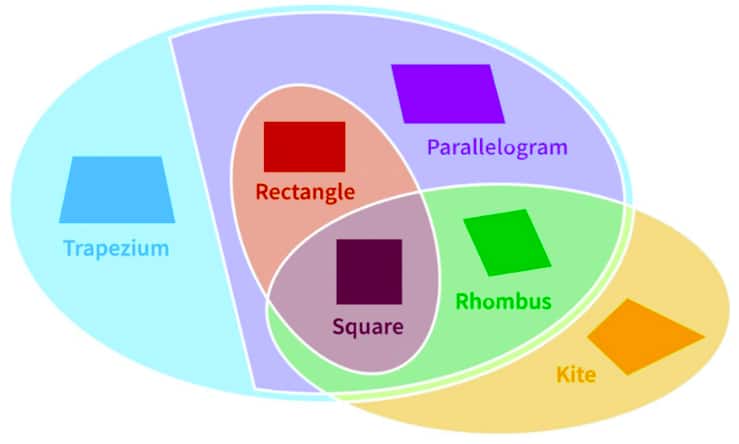
Question 4. Draw a Venn diagram showing the set of parallelograms, kites, rhombuses, rectangles, and squares. Then, answer the following questions—
(i) What is the quadrilateral that is both a kite and a parallelogram?
(ii) Can there be a quadrilateral that is both a kite and a rectangle?
(iii) Is every kite a rhombus? If not, what is the correct relationship between these two types of quadrilaterals?
Answer:
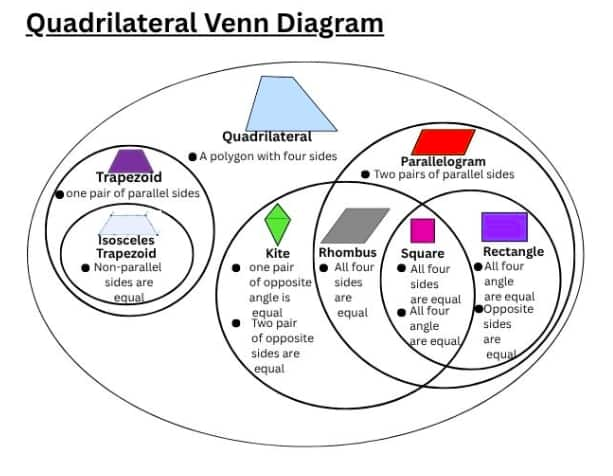
(i)
A rhombus is a quadrilateral that is both a kite and a parallelogram.
A kite has two pairs of adjacent equal sides, and A parallelogram has opposite sides equal and parallel.
A rhombus fits both definitions:
- It has adjacent equal sides (like a kite)
- It has opposite sides equal and parallel (like a parallelogram)
(ii)
Yes, there can be a quadrilateral that is both a kite and a rectangle, and that special case is a square.
Square satisfies the properties of both of them.
- All sides are equal. (which automatically gives two pairs of adjacent equal sides → kite).
- All angles are 90°. → rectangle.
So, a square is the only quadrilateral that is both a kite and a rectangle.
(iii)
No, not every kite is a rhombus.
A kite only requires two pairs of adjacent equal sides.
A rhombus requires all four sides to be equal.
Question 5. If PAIR and RODS are two rectangles, find ∠IOD.
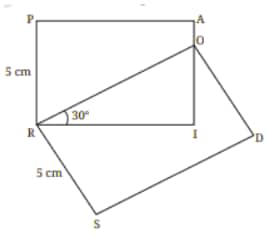
Answer:
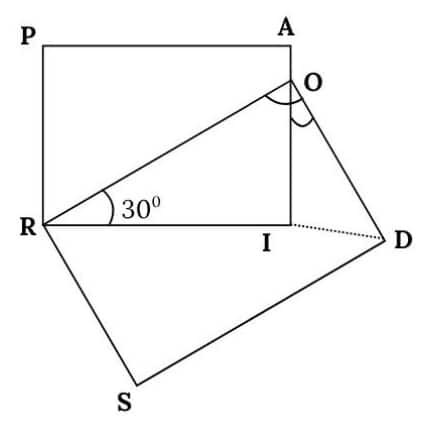
In rectangle PAIR, $\angle$I = 90° [All the angles of a rectangle is 90°]
So, in $\triangle$ROI, $\angle$ORI + $\angle$ROI + $\angle$RIO = 180°
⇒ 30° + $\angle$ROI + 90° = 180°
⇒ $\angle$ROI = 60°
In rectangle RODS, $\angle$O = $\angle$ROI + $\angle$IOD
⇒ 90° = 60° + $\angle$IOD
$\therefore$ $\angle$IOD = 30°
Question 6. Construct a square with a diagonal 6 cm without using a protractor.
Answer:
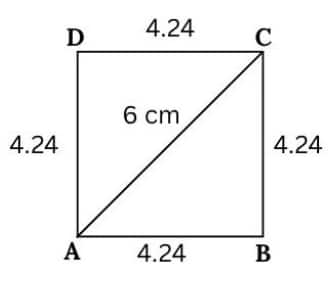
We know that. Diagonal of a square = $\sqrt2$ × side length
Here, $\sqrt2$ × side length = 6
$\therefore$ Side length = $\frac6{\sqrt2}=4.24$ (Approx)
Question 7. CASE is a square. The points U, V, W and X are the midpoints of the sides of the square. What type of quadrilateral is UVWX? Find this by using geometric reasoning, as well as by construction and measurement.
Find other ways of constructing a square within a square such that the vertices of the inner square lie on the sides of the outer square, as shown in Figure (b).
![]()
Answer:
CASE is a square. The points U, V, W and X are the midpoints of the sides of the square.
So, VU = UX = XW = WV
Also, all the angles are 90°.
So, UVWX is a square.
We can place a smaller square inside a bigger square and rotate it by 30° as shown in the picture so that the vertices of the inner square lie on the one-third points of the sides of the outer square.
It is also a square, but a bit tilted.
We can also draw the diagonals of the outer square and mark points at equal distances from the centre along both diagonals. After connecting these points in sequence, we will get a square.
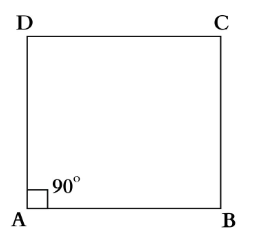
Question 8. If a quadrilateral has four equal sides and one angle of 90°, will it be a square? Find the answer using geometric reasoning as well as by construction and measurement.
Answer:
A square is a quadrilateral with four equal sides and four right angles, each measuring 90 degrees.
A rhombus also has four equal sides, and its opposite angles are equal. Also, its Adjacent angles are supplementary (sum to 180°).
So, we can say that if a rhombus has one right angle, then all angles are 90°, and it becomes a square.
Construction:
- Draw a line segment AB of fixed length (say 4 cm).
- At point A, construct an angle of 90°.
- With a compass, draw an arc of 4 cm from A to locate point D on the line perpendicular to AB.
- From B, draw an arc of 4 cm (using a compass).
- From D, draw another arc of 4 cm to intersect the arc from point B. Let the intersection be point C.
- Join points BC and CD.
Question 9. What type of quadrilateral is one in which the opposite sides are equal? Justify your answer.
Hint: Draw a diagonal and check for congruent triangles.
Answer:
A quadrilateral in which opposite sides are equal is a parallelogram.
But it could be a rectangle or even a rhombus or a square, which are all special types of parallelograms.
But with the condition being only just opposite sides being equal, we conclude that the quadrilateral is a Parallelogram.
Draw diagonal AC in the quadrilateral ABCD.
This divides the quadrilateral into two triangles:
- $\triangle$ABC
- $\triangle$CDA
In these two triangles, AC is the common side.
AB = CD [Given]
AD = BC [Given]
So, $\triangle$ABC $\cong$ $\triangle$CDA
By Corresponding Parts of Congruent Triangles are Congruent, we get:
- $\angle B A C=\angle D C A$
- $\angle A B C=\angle C D A$
And since both pairs of opposite angles are equal, and opposite sides are already equal, it satisfies the definition of a parallelogram.
Question 10. Will the sum of the angles in a quadrilateral, such as the following one, also be 360°? Find the answer using geometric reasoning as well as by constructing this figure and measuring.
![]()
Answer:
The sum of the angles in a quadrilateral is always 360°.
If we add BD, we will get two triangles, ADB and CDB.
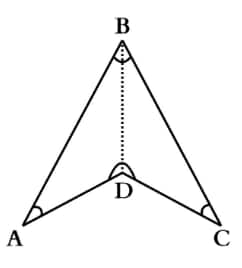
As we know, the sum of the angles of a triangle is always 180°.
So, Quadrilateal ABCD = $\triangle$ADB + $\triangle$CDB = 180° + 180° = 360°
Hence, proved.
Question 11. State whether the following statements are true or false. Justify your answers.
(i) A quadrilateral whose diagonals are equal and bisect each other must be a square.
(ii) A quadrilateral having three right angles must be a rectangle.
(iii) A quadrilateral whose diagonals bisect each other must be a parallelogram.
(iv) A quadrilateral whose diagonals are perpendicular to each other must be a rhombus.
(v) A quadrilateral in which the opposite angles are equal must be a parallelogram.
(vi) A quadrilateral in which all the angles are equal is a rectangle.
(vii) Isosceles trapeziums are parallelograms.
Answer:
(i) A quadrilateral whose diagonals are equal and bisect each other must be a square.
This statement is False.
A rectangle also has diagonals that are equal and bisect each other, but it is not necessarily a square unless all sides are equal.
(ii) A quadrilateral having three right angles must be a rectangle.
This statement is True.
If all angles are equal, each must be $90^\circ$, which is the property of a rectangle (and a square is a special rectangle).
So all angles are right angles, forming a rectangle.
(iii) A quadrilateral whose diagonals bisect each other must be a parallelogram.
This statement is True.
A defining property of a parallelogram is that its diagonals bisect each other.
(iv) A quadrilateral whose diagonals are perpendicular to each other must be a rhombus.
This statement is False.
A kite also has perpendicular diagonals, but is not necessarily a rhombus (as all sides of a kite are not equal).
(v) A quadrilateral in which the opposite angles are equal must be a parallelogram.
This statement is True.
In a quadrilateral, if both pairs of opposite angles are equal, the figure is a parallelogram.
(vi) A quadrilateral in which all the angles are equal is a rectangle.
This statement is True.
If all angles are equal, each must be $90^\circ$, which is the property of a rectangle (and a square is a special rectangle).
(vii) Isosceles trapeziums are parallelograms.
This statement is False.
An isosceles trapezium has only one pair of parallel sides, while a parallelogram requires two pairs of parallel sides.
Confused between CGPA and Percentage?
Get your results instantly with our calculator!
Quadrilaterals Class 8 Chapter 4 Solutions: Topics
The topics discussed in the NCERT Solutions for Class 8 Chapter 4 Quadrilaterals are:
- Rectangles and Squares
- Properties of Rectangles and Squares
- Properties of a parallelogram
- A Special Rectangle
- Angles in a Quadrilateral
- More Quadrilaterals with Parallel Opposite Sides
- Quadrilaterals with Equal Side Lengths
- Playing with Quadrilaterals
- Kite and Trapezium
Also, check,
Class 8 Maths Chapter 4 Quadrilaterals Solutions: Extra Questions
Question 1:
A square park has sides of length 18 cm. A 1 cm wide path along the edges is inside it. What is the area of the path?
Solution:
The outer square has sides of length 18 cm, so its area is 18 × 18 cm².
The inner square, formed by the 1 cm wide path along the edges, has sides
= 18 − (2 × 1) = 16 cm
The area of the inner square is = 16 ×16 cm²
Area of path = Area of the outer square − Area of the inner square
= (18 × 18) − (16 × 16)
= 324 − 256 = 68 cm²
Hence, the correct answer is 68 cm².
Question 2:
Parallel sides of a trapezium are 21 cm and 14 cm, and its area is 875 $\mathrm{cm}^2$. What is the distance between parallel sides?
Answer:
Given that the parallel sides of a trapezium are 21 cm and 14 cm, and its area is 875 $\mathrm{cm}^2$
Area of trapezium = $\frac{1}{2}\times (a+b)\times h$
where $a$ and $b$ are parallel sides and $h$ is the distance between parallel sides.
So, $\frac{1}{2}\times(21+14)\times h=875$
⇒ $h=50$
Hence, the correct answer is 50 cm.
Question 3:
The length of the diagonals of a rhombus is 40 cm and 60 cm. What is the length of the side of the rhombus?
Answer:
Let's denote the length of the side of the rhombus as $s$ and the diagonal as $d_1$ and $d_2$.
According to the given information, the diagonals of the rhombus are 40 cm and 60 cm.
These diagonals divide the rhombus into four congruent right-angled triangles.
Using the Pythagorean theorem, we can write the following equation for one of the right-angled triangles:
$(\frac{d_1}{2})^2 + (\frac{d_2}{2})^2 = (s)^2$
Simplifying this equation:
⇒ $(\frac{40}{2})^2 + (\frac{60}{2})^2 = (s)^2$
⇒ $(20)^2 + (30)^2 = (s)^2$
⇒ $s^2 = 1300$
⇒ $s = \sqrt{1300}$
⇒ $s = 10\sqrt{13}\ \text{cm}$
Hence, the correct answer is $10\sqrt13\ \text{cm}$.
Question 4:
What is the area of a rhombus whose diagonals are 8 cm and 13 cm?
Answer:
Length of one diagonal ($d_1$) = 8 cm
Length of the other diagonal ($d_2$) = 13 cm
We know, the area ($A$) of a Rhombus = $\frac{1}{2}d_1d_2=\frac{1}{2}$× 8 × 13 = 52 $\mathrm{cm}^2$
Hence, the correct answer is 52 $\mathrm{cm}^2$.
Question 5:
Half of the perimeter of a rectangle is 30 cm. If the length of the rectangle is 6 cm more than its breadth, then what is the area of the rectangle?
Answer:
Half of the perimeter of a rectangle is 30 cm.
Let the length be $x$.
So, breadth = $x-6$
Total perimeter = 30 × 2
⇒ $2(x+x-6)=60$
⇒ $4x=72$
$\therefore x=18$
So, length = 18, breadth = 18 – 6 = 12
$\therefore$ Area of a rectangle = length × breadth = 18 × 12 = 216 $\mathrm{cm}^2$
Hence, the correct answer is 216 $\mathrm{cm}^2$.
NCERT Solutions for Class 8 Maths Chapter 4 Quadrilaterals: Notes
These Quadrilaterals notes have been carefully prepared by experienced Careers360 teachers to help students revise more quickly and effectively. These notes also help them understand the Class 8 Quadrilaterals solutions better, so they can solve similar problems independently next time.
Quadrilaterals
Quadrilaterals are an important part of geometry. They have four sides. There are some important quadrilaterals, i.e. squares, rectangles, trapeziums, rhombuses, kites, and parallelograms.
A quadrilateral also has four angles, four vertices, 12 edges, and two diagonals.
Rectangle
A rectangle is a quadrilateral with opposite sides that are equal in length and all four interior angles that are right angles (90 degrees).
Properties:
- Opposite sides are equal in length.
- Opposite sides are parallel.
- All four angles are right angles (90 degrees).
- Diagonals are equal in length.
- Diagonals bisect each other but do not necessarily bisect the angles.
Square
A square is a quadrilateral with four equal sides and four right angles, each measuring 90 degrees.
Properties:
- All four sides are of equal length.
- All four angles are right angles.
- Opposite sides are parallel.
- Diagonals are equal in length and bisect each other at right angles.
- A square is a type of rhombus and a type of rectangle.
Parralleogram
A parallelogram is a four-sided quadrilateral or polygon with distinctive properties from other quadrilaterals.
Properties:
- Opposite sides are equal.
- Opposite sides are parallel to each other.
- Opposite angles are equal.
- Diagonals bisect each other.
- Adjacent angles sum up to 180°.
Rhombus
A rhombus is a type of quadrilateral with all four sides of equal length.
Properties:
- All four sides are of equal length.
- Opposite sides are parallel.
- Opposite angles are equal.
- Adjacent angles are supplementary (sum = 180 degrees).
- Diagonals are perpendicular and bisect each other.
- Each diagonal divides the rhombus into two congruent triangles.
Trapezium
A trapezium is a type of quadrilateral that has at least one pair of parallel sides.
Properties:
- At least one pair of opposite sides (Bases) is parallel.
- Non-parallel sides are called legs.
- The angles between a base and a leg are supplementary.
- In an isosceles trapezium, the diagonals are equal.
Kite
A kite is a quadrilateral with two distinct pairs of adjacent sides that are equal in length.
Properties:
- It has two pairs of adjacent equal sides.
- One pair of opposite angles is equal.
- Diagonals are perpendicular to each other, with the longer diagonal bisecting the shorter one.
NCERT Solutions for Class 8 Maths Chapter 4 Quadrilaterals: Important Formulae
Here are some important formulae from Class 8 Maths NCERT Chapter 4 Quadrilaterals, that will help students not only in this class but also in future classes.
|
Name of the Quadrilateral |
Perimeter |
Area |
|
Square |
4 × Side |
Base × Height |
|
Rectangle |
2 × (Length + Breadth) |
Length × Breadth |
|
Parallelogram |
2 × (Base + Side) |
Side × Side |
|
Rhombus |
4 × Side |
$\frac{1}{2}$ × Diagonal$_1$ × Diagonal$_2$ |
|
Kite |
2 × (Sum of the unequal adjacent pairs) |
$\frac{1}{2}$ × Diagonal$_1$ × Diagonal$_2$ |
|
Trapezium |
Sum of all the sides |
$\frac12$ × Height or Distance between parallel sides × (Sum of length of parallel sides/Sum of bases of the trapezium) |
Why are Class 8 Maths Chapter 4 Quadrilaterals Question Answers Important?
The 4th Chapter, Quadrilaterals, of class 8, helps students learn about different four-sided shapes and their properties. This chapter also helps to understand how to find angles, sides, and parallel lines in shapes like rectangles, squares, and kites. These Class 8 Maths Chapter 4 Quadrilaterals question answers make it easier to understand these shapes through examples and practice. Here are some more points on why these question answers are important:
- They help you clearly understand the properties of rectangles, squares, and other quadrilaterals.
- The question answers improve your ability to find angles and sides in different shapes.
- These concepts are very useful in geometry and mensuration topics in higher classes.
- Practising Class 8 Maths Quadrilaterals question answers builds strong basics and improves your confidence in solving shape-based problems.
- Parents can help their children practice using the NCERT Class 8 Maths Chapter 4 Worksheet with answers at home.
NCERT Solutions for Class 8 Mathematics Chapter Wise
Explore complete NCERT Solutions for Class 8 Maths using the chapter links below.
NCERT Books and NCERT Syllabus
The following links will provide students with access to the latest NCERT syllabus and some reference books.
NCERT Solutions for Class 8 Maths Chapter 4 help students understand the properties of different quadrilaterals in a clear and structured way. The step-by-step explanations make angle sums and relationships easy to apply in problems. Practising these solutions strengthens geometric reasoning and accuracy. Overall, they build a solid foundation for advanced geometry concepts.
Frequently Asked Questions (FAQs)
The main topics discussed in this chapter are:
Properties of Rectangles and Squares
Properties of a parallelogram
Properties of Rhombus
Properties of Kite and Trapezium
These solutions are designed in a very simple, student-friendly and step-by-step format with clear explanations and solved examples so that students can grasp the concepts easily. Necessary formulas are also discussed here.
Yes, these solutions from the NCERT textbook exercises are enough to score well in the Class 8 final exam. For further practice purposes, students can use NCERT examples and various practice books such as RS Aggarwal, etc.
The sum of all interior angles of any quadrilateral is always 360°, no matter the type or shape.
Various educational sites, such as Careers360, have prepared these solutions and made them available for free so that these solutions can be beneficial for students.
A quadrilateral is a polygon with four sides and four angles.
The main types include square, rectangle, parallelogram, rhombus, trapezium, and kite.
In a parallelogram,
Opposite sides are equal and parallel.
Opposite angles are equal.
Diagonals bisect each other.
A trapezium (or trapezoid) is a quadrilateral with only one pair of parallel sides. The non-parallel sides are called legs.

Popular Questions
A block of mass 0.50 kg is moving with a speed of 2.00 ms-1 on a smooth surface. It strikes another mass of 1.00 kg and then they move together as a single body. The energy loss during the collision is
| Option 1)
|
Option 2)
|
| Option 3)
|
Option 4)
|
An athlete in the olympic games covers a distance of 100 m in 10 s. His kinetic energy can be estimated to be in the range
| Option 1)
|
Option 2)
|
| Option 3)
|
Option 4)
|
A particle is projected at 600 to the horizontal with a kinetic energy . The kinetic energy at the highest point
| Option 1)
|
Option 2)
|
| Option 3)
|
Option 4)
|
In the reaction,
| Option 1)
|
Option 2)
|
| Option 3)
|
Option 4)
|
How many moles of magnesium phosphate, will contain 0.25 mole of oxygen atoms?
| Option 1)
0.02 |
Option 2)
3.125 × 10⁻² |
| Option 3)
1.25 × 10⁻² |
Option 4)
2.5 × 10⁻² |