

Use Maths To Understand Your Marks, Chart Your Progress
Education is like a big adventure with tests, assignments, and grades along the way. Sometimes, it can be tricky to know how well you're doing and how to get better. That's where maths comes in, like a helpful guide, to understand your school journey. This article is all about how maths can help you not only figure out how you're doing in school but also solve everyday problems using numbers.

Power Of Percentiles
How do you interpret your scores? How do you know where you stand compared to your peers? This is where mathematics steps in, offering a clear and objective method of measurement: percentiles.
Imagine you've scored 120 on a standardised test, and your percentile rank is calculated to be 85. This percentile rank reveals that you've outperformed 85 per cent of the test-takers. In essence, it places you within your peer group based on your score.
Exploring Trends with Averages
Consistency is key when it comes to academics. Whether you're tracking your monthly test scores, daily assignments, or quiz results, mathematics provides you with a valuable tool to understand your performance better. The average, often referred to as the mean, is a mathematical concept that can give you insights into your overall progress.
Calculating an average is simple—just sum up your scores and divide by the number of assessments. The result provides a holistic perspective on your performance.
If the average score is above a certain threshold, he can conclude that he's doing well overall. This realisation motivates him to stay consistent with his daily homework, knowing that it contributes to his satisfactory average test score.
Confused between CGPA and Percentage?
Get your results instantly with our calculator!
Identifying Strengths and Weaknesses
As you progress in your academic journey, you'll find that certain subjects come more naturally to you, while others pose challenges. Mathematics empowers you to identify these strengths and weaknesses through tools such as histograms, which provide a visual representation of your performance.
A histogram is a graphical representation that helps you understand the distribution of scores. It allows you to identify patterns in your performance.
By creating a histogram of her history test scores, anyone can quickly identify which scores appear most frequently.
Also check - 10 Reasons Why Maths Is Important in Life
Setting Goals for Improvement
Goals are a fundamental part of the educational journey. Whether you want to improve your test scores, achieve a particular GPA, or master a specific subject, mathematics empowers you to set and track these objectives.
Mathematics helps you quantify your goals. You can calculate the increase or improvement required to reach your desired level of achievement.
For instance, Raju wants to enhance his science test score and reach a specific target. He's unsure how much he needs to improve. By determining the required percentage increase from his current score to the target score, he can set a specific and attainable goal.
Understanding Odd Results
At times, students encounter unexpected or unusual results in their academic performance. It could be late-night study sessions, changes in daily routines, or other factors. Mathematics comes to the rescue by helping you determine if there's a significant relationship between these factors and your performance.
This concept involves hypothesis testing to determine if observed differences are statistically significant. It helps you decide whether specific factors have a meaningful impact on your results.
Sohan is curious whether his late-night study habits affect his maths test scores. He wants to know if there's a meaningful connection between these variables. Sohan collects data on his test scores and the number of hours he studies late at night. By performing statistical tests, such as a t-test, he can determine if there's a statistically significant difference in test scores between nights with late-night study and nights without.
Predicting the Future
Mathematics isn't limited to analysing your past and present performance; it can also give an insight to the future. Predictive modelling, often achieved through regression analysis, allows you to forecast your future performance based on historical data and relevant factors.
Regression analysis uses historical data and mathematical equations to make informed predictions about future performance. Such as linear regression
Y = mX + c
Calculating Your Progress
Measuring progress is an essential part of personal and academic development. Mathematics provides the means to measure and track your advancement toward your goals. To monitor your progress, you can calculate the difference between your current status and your target goal.
Maya wants to enhance her maths skills and raise her test scores. She decides to measure her progress each month to ensure she's on the right track. Maya uses a formula for tracking progress by subtracting her current score from her target score. She does this for each month and plots her progress on a line graph. This visual representation helps her track her progress and make informed decisions about her study strategies.
Statistical Distributions and Interpretation Of Outliers
Analysing test scores, understanding statistical distributions, and interpreting outliers is crucial.
A statistical distribution reveals how scores are spread out over a range. One commonly encountered distribution is the normal distribution, often known as the bell curve. This distribution, characterised by its symmetrical shape, indicates that most scores cluster around the mean (average), with fewer scores spreading out toward the tails. Recognising the nature of the distribution of test scores is valuable in assessing stability in performance.
Mathematically, the probability density function of a normal distribution is represented as:
f(x) = σ²π^(-1/2) * e^(-(x-μ)² / (2σ²))
Where:
f(x) is the probability density function.
x is the test score.
μ is the mean (average) score.
σ is the standard deviation, which measures the spread of the scores.
Outliers are data points that deviate significantly from the norm. In the context of test scores, an outlier might indicate exceptional performance or an underlying issue affecting a student's results.
Mathematics aids in identifying outliers by establishing thresholds beyond which data points are considered unusual. One common method is the use of the interquartile range (IQR) to define outliers as data points that fall outside a certain multiple of the IQR.
Mathematically, the IQR is calculated as the difference between the third quartile (Q3) and the first quartile (Q1) of the data. Outliers are then identified using the following formula:
Outliers = {x : x < Q1 - k * IQR or x > Q3 + k * IQR}
Where:
x is a data point.
Q1 is the first quartile.
Q3 is the third quartile.
k is a user-defined constant that determines the threshold for outliers.
For example, if a student has a series of test scores in mathematics and wants to identify potential outliers using a value of k = 1.5, they would calculate the IQR and apply the formula to determine which scores fall outside the established threshold.
Statistical Significance
Mathematics provides the tools to statistically determine whether observed differences or patterns are statistically significant or the result of random variation.
One common method for establishing statistical significance is hypothesis testing. This involves setting up null hypotheses (H0) and alternative hypotheses (H1) to determine if an effect is statistically significant.
For example, a student wants to investigate whether the time spent on extracurricular activities significantly impacts their test scores. The null hypothesis (H0) could be that there is no significant effect, while the alternative hypothesis (H1) could be that there is a significant effect.
Mathematically, hypothesis testing involves calculating a test statistic, such as a t-statistic, and comparing it to a critical value based on a significance level (α). If the test statistic exceeds the critical value, one may reject the null hypothesis in favour of the alternative, suggesting a statistically significant effect.
Also check - How Can Maths Help You Become A Smart Shopper?
Calculations for Goal Progress Tracking
To monitor progress toward an academic goal, students can employ mathematical calculations. The most straightforward approach is to calculate the difference between the current status and the target goal.
For instance, consider a student with a current GPA of 3.2 who aims to achieve a GPA of 3.5. The mathematical calculation for tracking progress is:
Progress Toward Goal = Target GPA - Current GPA
Mathematics not only allows students to determine progress but also helps them create visual representations of their journey. Line graphs, bar charts, or progress charts can be invaluable tools.
Let's consider a practical example where a student aims to track their progress in improving their maths test scores. Their initial score is 75, and they've set a goal of achieving a score of 85. The student intends to track their progress over four months, taking monthly tests.
Month 1: Test Score = 75
Month 2: Test Score = 78
Month 3: Test Score = 82
Month 4: Test Score = 84
To calculate their progress over these four months, the student can use the formula mentioned earlier:
Progress Toward Goal = Target Score - Current Score
Here's how the progress toward the goal is calculated for each month:
Month 1: 85 - 75 = 10
Month 2: 85 - 78 = 7
Month 3: 85 - 82 = 3
Month 4: 85 - 84 = 1
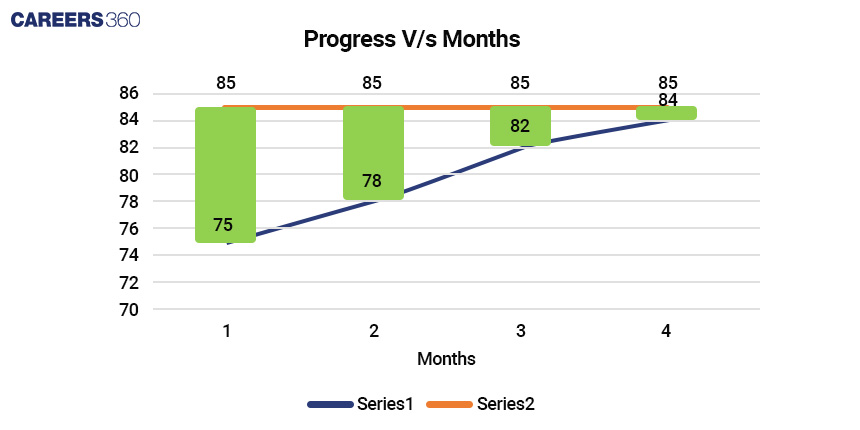
The student can then create a line graph with months on the x-axis and progress toward the goal on the y-axis. This graph visually represents their progress over time and helps them stay on track to achieve their target score of 85.
Mathematics is an invaluable tool that empowers students to navigate their academic journey with precision. With mathematics as their guide, students can confidently make data-driven decisions and excel in their educational pursuits.
