

Supply And Demand: A Mathematical Analysis Of Market Equilibrium
The market is a complex system that determines the prices of goods and services in an economy. The interaction between buyers and sellers, or the forces of supply and demand, is the main driver of price fluctuations. The game of supply and demand is a fascinating subject that has been studied by economists for centuries, and its principles form the foundation of modern microeconomics.

In this article, we will delve into the mathematics behind supply and demand, exploring how these principles are applied to achieve market equilibrium. We will examine the factors that affect the supply and demand curves, how the intersection of these curves determines the equilibrium price and quantity. Additionally, we will analyse the effects of shifts in supply and demand, and how they can lead to changes in the equilibrium price and quantity.
Also check - Protect Financial Accounts With These Class 12 Algebra Concepts
Aggregate Supply
It refers to the total amount of goods and services that an economy can produce and supply at a given price level over a specific period. It represents the total production of all firms, industries, and sectors within an economy.
Aggregate supply is influenced by factors such as the availability of resources, technology, capital, labour, and the overall efficiency of the economy. The relationship between the aggregate supply and the price level is known as the aggregate supply curve, which typically has a positive slope, indicating that as the price level increases, the aggregate supply also increases.
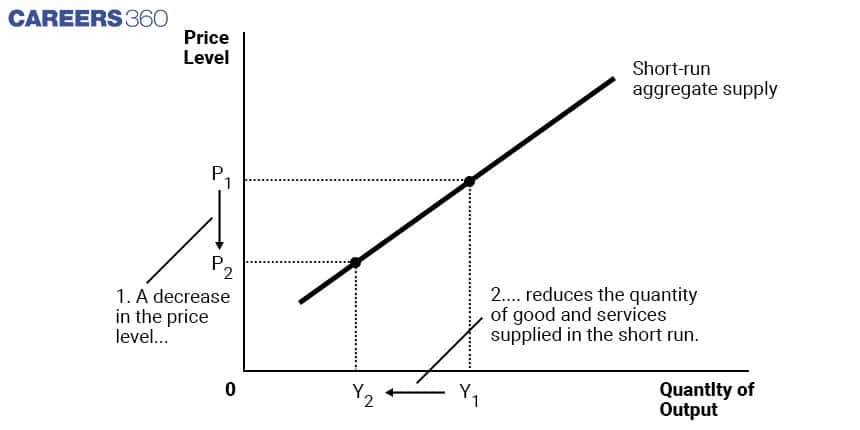
Mathematically we can write an equation of Aggregate supply as
Qs(P) = a+bP
Here Qs = Aggregate Supply, P = Price Level, a and b are constant that determines the slope of the supply curve.
The supply curve is upward-sloping because as the price of the product increases, the quantity supplied increases.
Aggregate Demand
It refers to the total amount of goods and services that households, businesses, and governments in an economy are willing and able to buy at a given price level over a specific period. It represents the overall demand for goods and services within an economy.
It consists of four components
Consumption (C)
Investment (I)
Government Spending (G)
Net Exports (Export-Import) (X-M)
Thus, Aggregate Demand = C + I + G + (X-M) Aggregate demand over the long-term equals gross domestic product (GDP) because the two metrics are calculated in the same way.
Aggregate demand is influenced by various factors, such as consumer spending, investment, government spending, and net exports. The relationship between the aggregate demand and the price level is known as the aggregate demand curve, which typically has a negative slope, indicating that as the price level increases, the aggregate demand decreases.
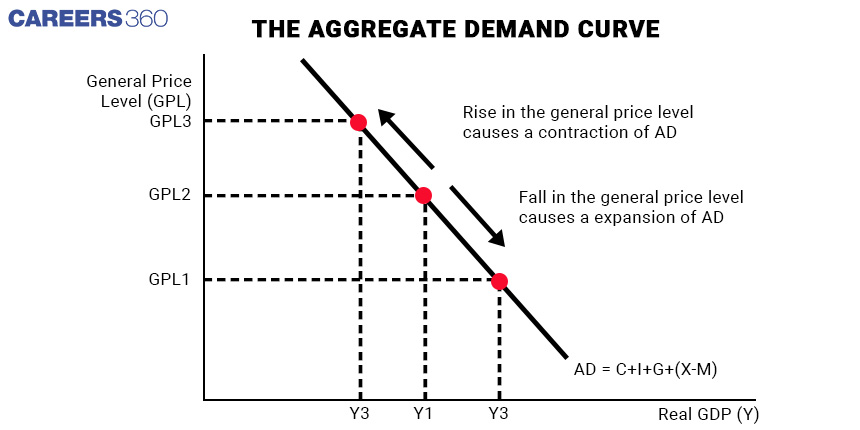
Mathematically we can write an equation of supply as
Qd(P) = c-dP
Here Qd = Aggregate Demand, P = Price Level, c and d are constant that determines the slope of the demand curve.
The demand curve is downward sloping because as the price of the product increases, the quantity demanded decreases.
To find the market equilibrium, we need to find the price and quantity at which the quantity demanded equals the quantity supplied. This is known as the equilibrium price and quantity. At equilibrium aggregate demand is equal to aggregate supply. This can be visualised using the following graphs.
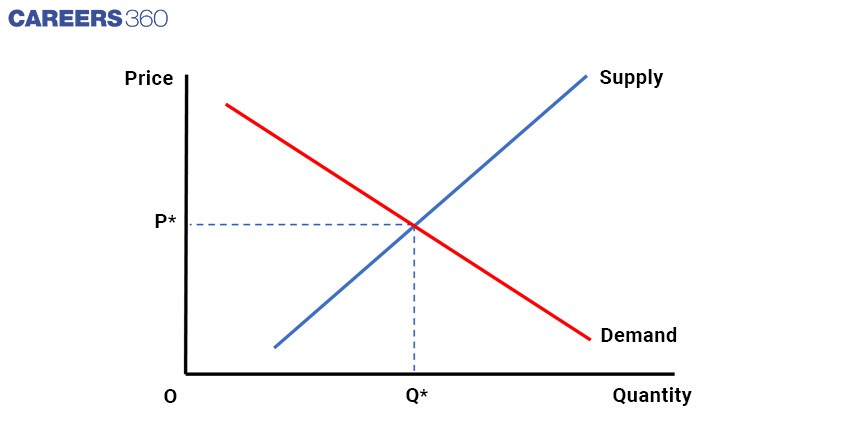
Mathematically we can find the equilibrium price and quantity as
Qd(P) = Qs(P)
c-dP = a+bP
p* = (c-a)/(b+d)
Where p* = Equilibrium Price
Substituting this value of P* into either the demand or supply function gives us the equilibrium quantity.
Q* = c-dP*
Q*= c-d{(c-a)/(b+d)}
Q* = (bc+ad)/(b+d)
Where Q* = Equilibrium Quantity
Confused between CGPA and Percentage?
Get your results instantly with our calculator!
Changes In Equilibrium
The equilibrium can be changed by a change in supply and demand.
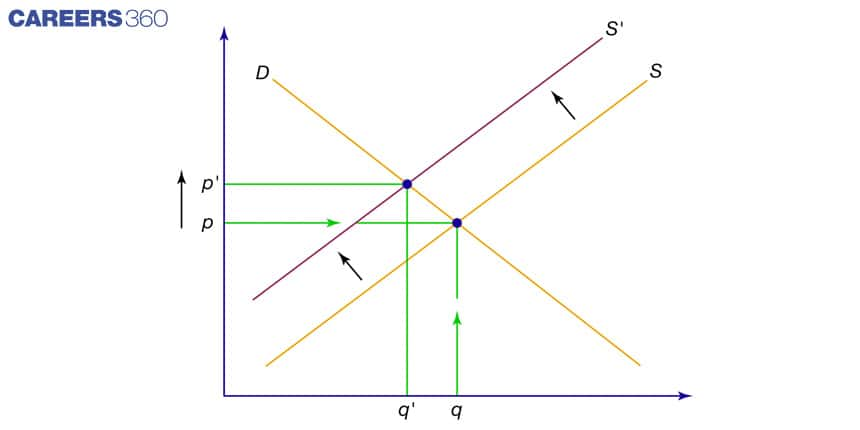
By Change In Supply
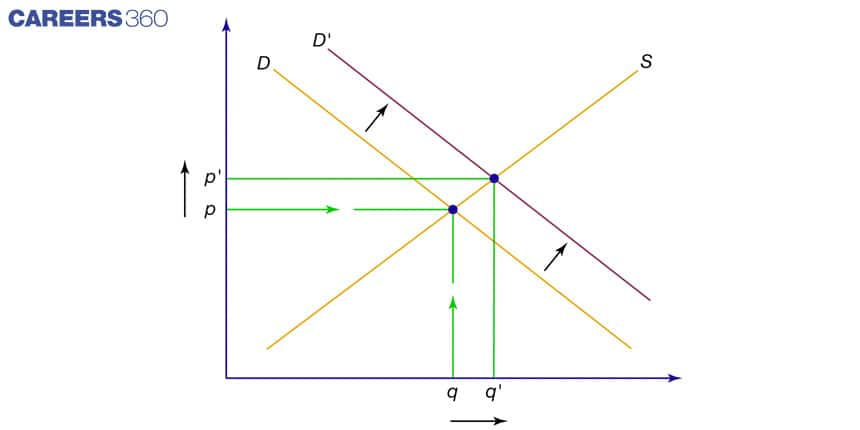
If the quantity supplied increases, it can lead to either an upward shift in the demand curve or a decrease in the price of the product to reach a new equilibrium. Conversely, if the quantity supplied decreases, it can result in either an increase in the price of the product or a decrease in demand to reach a new equilibrium. This phenomenon can be illustrated using the following curve.
Also check - Electrical Current: How Much Too Much For A Human Being
By Change In Demand
An increase in the money supply can result in a higher demand for a product, which can lead to either an increase in the product's price or an increase in supply to reach a new market equilibrium. Conversely, a decrease in the money supply can result in a lower demand for a product, which can cause a decrease in the product's price or a decrease in aggregate supply to reach a new market equilibrium. This phenomenon can be visualised using the following curve.
Factors That Affect The Demand And Supply
There are several factors that can affect the supply and demand curves and shift them to the left or right, causing changes in the equilibrium price and quantity. These factors include
Changes in consumer income: When consumer income increases, demand for most goods and services will also increase, resulting in a shift to the right of the demand curve. Conversely, if consumer income decreases, demand will decrease, causing the demand curve to shift to the left.
Changes in the price of related goods: The demand for a product may be affected by the price of related goods, such as substitutes or complements. If the price of a substitute product increases, demand for the original product may increase, causing the demand curve to shift to the right. Conversely, if the price of a complement product increases, demand for the original product may decrease, causing the demand curve to shift to the left.
Changes in population and demographics: Changes in population size or demographics can affect demand for certain goods and services. For example, an ageing population may increase the demand for healthcare services, while a growing population of young people may increase the demand for entertainment and education.
Changes in technology: Changes in technology can affect both supply and demand for a product. For example, technological advances in manufacturing may decrease the cost of production, resulting in an increase in supply and a decrease in price.
Changes in production costs: Changes in production costs, such as wages or raw material prices, can affect the supply of a product. If production costs increase, supply may decrease, causing the supply curve to shift to the left. Conversely, if production costs decrease, supply may increase, causing the supply curve to shift to the right.
Thus the invisible hand of the market i.e demand and supply of a product determine the price and quantity produced in the market.
