

Discover How Class 12 Derivatives Help In Real Life
Have you ever noticed how things around us are always shifting and altering? That's what we call rate changes. They're like the heartbeat of change in our world, affecting everything from how fast a car moves to how temperatures rise and fall.
Think of rate changes as how quantities—like speed, temperature, or even profits—shift and transform over time. In maths, we call this concept derivatives, but it's more than just numbers and graphs. It's the language of change in our everyday lives. NCERT Class 11 and Class 12 cover these concepts in chapters like Limit, Derivation, and their Applications.
This article isn't about complicated equations. It's about uncovering how these rate changes sneak into our daily experiences. Keep reading the article to understand concepts of derivatives, their fundamentals, and their applications including how rate changes affect what we do and see every day, making predictions, solving problems, and helping us understand the world better.
What is Derivative or Rate Change?
A derivative, often linked with the rate of change, represents how a function or quantity changes concerning another. It captures the slope of a curve at a particular point or the rate of change of a quantity at a specific instant. In calculus, it's calculated as the limit of the ratio of the change in one quantity to the change in another, as the second quantity approaches zero.
For functions described by f(x), the derivative, usually denoted as f' (x) or dy/dx, signifies the instantaneous rate of change of f(x) concerning x. Geometrically, it represents the slope of the tangent line to the curve of the function at a specific point.
Derivatives hold extensive applications in various fields like mathematics, physics, economics, and engineering. They are utilised to analyse motion, predict behaviour, solve optimisation problems, and comprehend the behaviour of complex systems. Also, they help understand temperature changes, alterations in shapes and sizes of objects based on conditions, and more.
Also Read | Understanding Binary Operations: The Language Of Computers
Rate of Change of a Quantity
This stands as the most crucial use of derivatives. For instance, to assess how fast the volume of a cube changes as its sides decrease, we use dy/dx. Here, dy represents the volume change, and dx represents the side change of the cube.
Confused between CGPA and Percentage?
Get your results instantly with our calculator!
Increasing and Decreasing Functions
Derivatives aid in determining if a function increases, decreases, or stays constant on a graph. If f is a continuous function in [p, q] and differentiable in the open interval (p, q):
f increases at [p, q] if f'(x) > 0 for every x ∈ (p, q).
f decreases at [p, q] if f'(x) < 0 for every x ∈ (p, q).
f remains constant in [p, q] if f'(x) = 0 for every x ∈ (p, q).
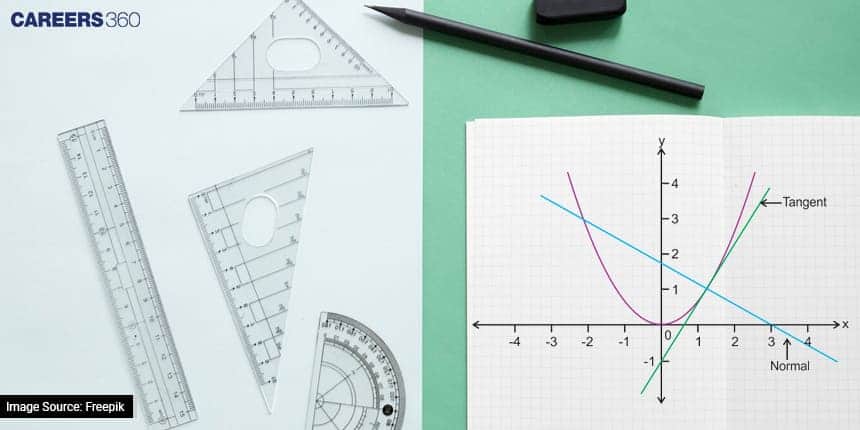
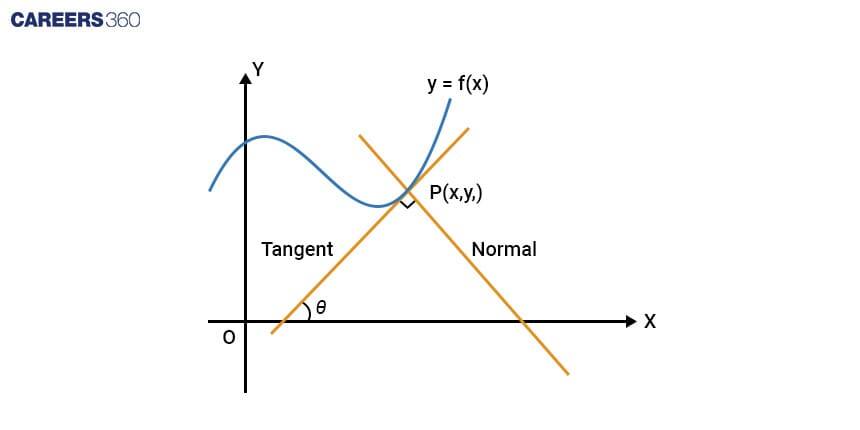
Tangent and Normal to a Curve
The tangent touches a curve at a point without crossing it, while the normal stands perpendicular to this tangent.
Let the tangent intersect the curve at P(x1, y1).
The equation for a straight line passing through a point with a slope of m is:
y – y1 = m(x – x1)
From this equation, the slope of the tangent to the curve y = f(x) at point P(x1, y1) is represented as dy/dx at P(x1, y1) = f'(x). Hence,
The equation of the tangent to the curve at P(x1, y1) is:
y – y1 = f'(x1)(x – x1)
The equation of the normal to the curve is:
y – y1 = [-1/ f'(x1)] (x – x1)
=> (y – y1) f'(x1) + (x - x1) = 0
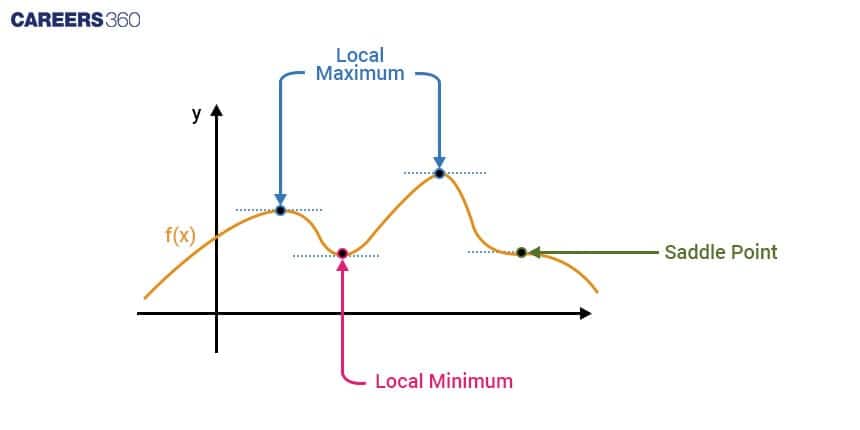
Maxima and Minima
To find the highest or lowest point on a curve or determine its turning points, derivatives come into play.
At x = a, if f(x) ≤ f(a) for every x in the domain, then f(x) has an Absolute Maximum value, and a is the point of the maximum value of f.
At x = a, if f(x) ≤ f(a) for every x in some open interval (p, q), then f(x) has a Relative Maximum value.
At x = a, if f(x) ≥ f(a) for every x in the domain, then f(x) has an Absolute Minimum value, and a is the point of the minimum value of f.
At x = a, if f(x) ≥ f(a) for every x in some open interval (p, q), then f(x) has a Relative Minimum value.
Monotonicity
Functions are termed monotonic when they consistently either increase or decrease across their entire domain. Examples include f(x) = ex, f(x) = nx, and f(x) = 2x + 3.
Functions exhibiting both increasing and decreasing behaviour within their domain are termed non-monotonic. For instance: f(x) = sin x, f(x) = x2.
Monotonicity at a Point
A function is deemed monotonically decreasing at x = a if f(x) satisfies:
f(x + h) < f(a) for a small positive h
f'(x) is positive if the function increases
f'(x) is negative if the function decreases
f'(x) is zero at maxima or minima
Approximation or Finding Approximate Value
Derivatives aid in approximating small changes in quantity. The approximate value is represented by delta △. For instance, if the change in the value of x, dx = x, then dy/dx = △x = x.
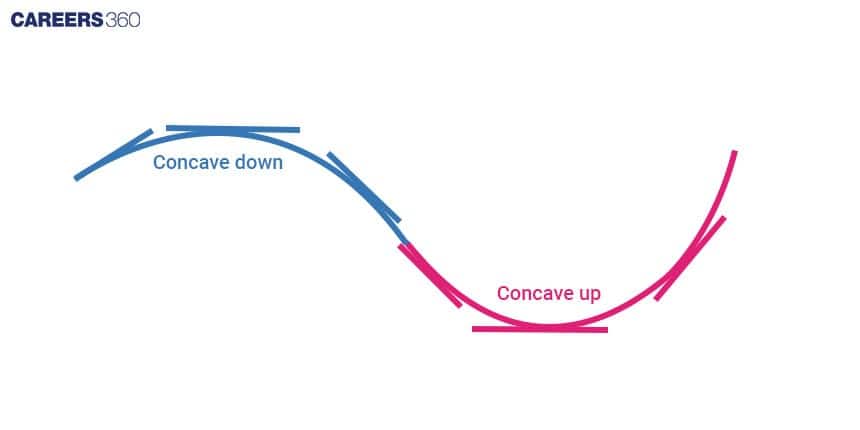
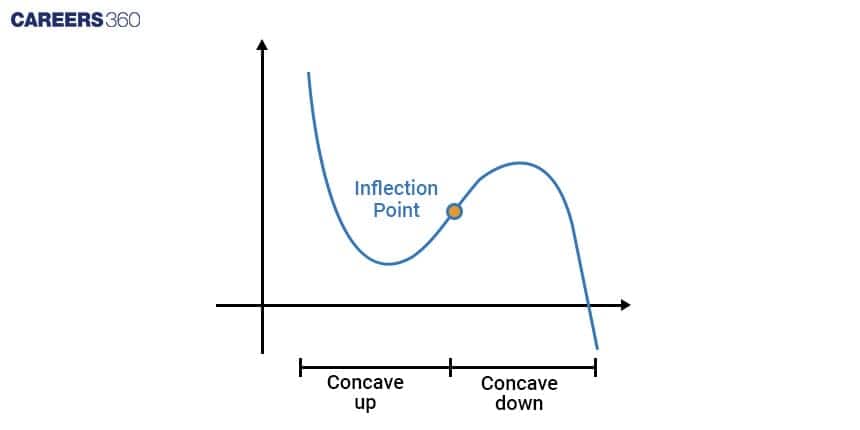
Point of Inflection
>> Concave Up: When a curve bends upwards, forming a shape like a cup, it's called concave up or convex down.
>> Concave Down: When a curve bends downwards, creating a shape similar to a cap, it's termed concave down or convex up. In simple terms, the tangent lies below the curve when the slope of the tangent increases along with the independent variable.
In a continuous function f(x)
If f”(x) < 0 for x ∈ (a, b), the curve y = f(x) is concave downward.
If f”(x) > 0 for x ∈ (a, b), the curve y = f(x) is concave upwards.
The inflection point marks where the slope of a function's graph is zero. The graph below displays this function's inflection point.
Real-Life Applications of Derivatives
Also Read | Understanding Integration: The Power Of Substitution Method
Calculating profit and loss in business using graphs: In the world of business, tracking profits and losses is crucial. Graphs help visualise how a business is performing over time. A rising line indicates profits, while a declining line signifies losses. By analysing these graphs, businesses can spot trends, identify successful periods, or pinpoint areas that need improvement. It's like looking at a map of a business's financial journey, helping owners make informed decisions to steer towards success.
Monitoring temperature variations: Temperature changes impact our daily lives and the environment. Monitoring these changes helps in various fields like agriculture, meteorology, and even urban planning. Graphs showcasing temperature variations over time provide valuable insights. They help scientists understand climate patterns, farmers predict crop growth, and city planners prepare for weather-related challenges like heat waves or cold spells.
Determining speed or distance covered: Speed and distance are essential in transportation and sports. By tracking speed over time using graphs, we can visualise how fast something moves or how far it travels. This data is crucial for athletes to improve performance, engineers to optimise vehicle efficiency, and even for understanding the movement patterns of various objects or living beings.
Deriving equations in Physics: Physics relies heavily on equations to explain natural phenomena. Graphs help visualise these equations by plotting relationships between various physical quantities. For instance, a graph of velocity against time illustrates acceleration or deceleration. Graphs aid physicists in understanding complex concepts like motion, force, energy, and much more, making abstract theories more tangible and understandable.
Seismology studies: Seismology, the study of earthquakes and seismic waves, heavily depends on analysing seismic data. Graphs of seismic activity over time and location help seismologists estimate the magnitude and location of earthquakes. These graphs assist in understanding the Earth's structure and predicting potential seismic hazards, aiding in disaster preparedness and response.
Hope this helps you to understand the concept of derivative or rate change including slope, maxima, minima, monotonicity, approximation, and its applications in daily life.
