

Type Of Venn Diagrams And Its Uses Class 11
Venn Diagrams: Venn diagrams are visual representations using closed curves like circles or rectangles of similarities and differences when two concepts and sets are compared to each other. Venn diagrams were introduced by English logician John Venn (1834-1883) they are also known as set diagrams or logic diagrams which are widely used in multiple branches of mathematics like statistics and probability, set theory, and semiconductor electronics(Logic gate) in physics. Also, concepts of Venn diagrams are very helpful in business, computer science, and engineering. Let's discuss the type of Venn diagrams, their applications, and some practice questions for both Boards and JEE Main Exams.

What Is A Venn Diagram
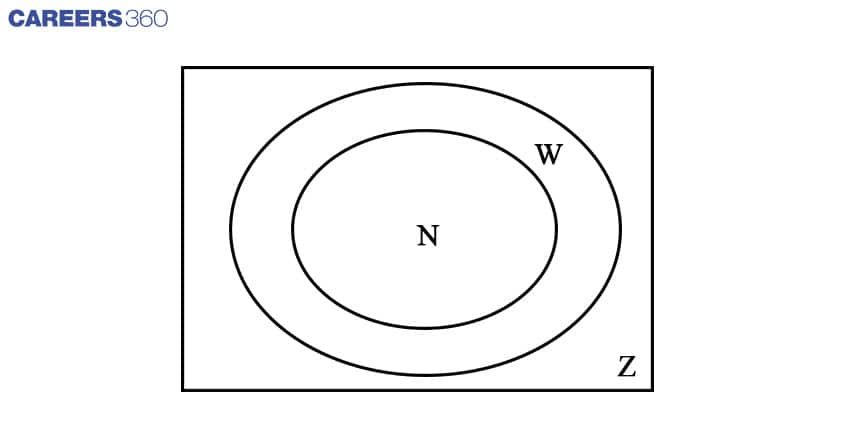
Venn diagrams are visual diagrams that represent the relationship of sets. For example, a set of natural numbers is a subset of whole numbers. And whole numbers are also a subset of integers. See the diagram below to get a better understanding on what is a Venn diagram.
Here,
Z represents integers which is a universal set.
W represents whole numbers that are a subset of the Integers (Z).
N represents natural numbers which are subsets of whole numbers(W).
The universal set (U) is generally represented by a rectangular shape which includes all the sets and subsets that are usually represented by circles or oval shapes.
Venn Diagram Of Two Sets
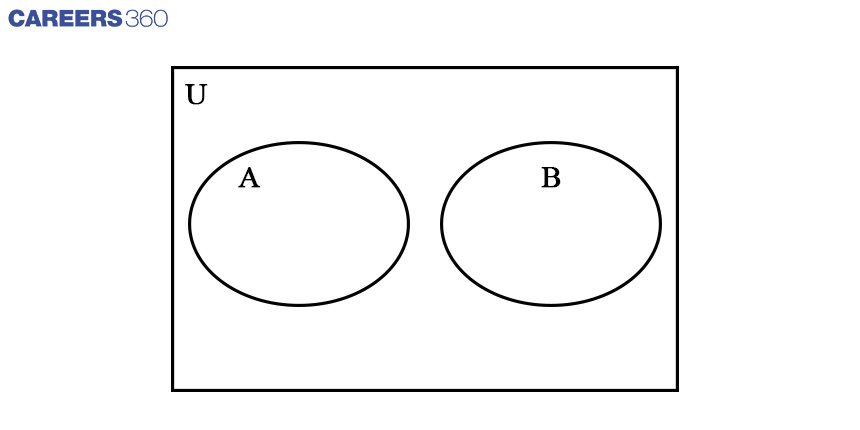
Let's consider two sets A and B that are represented by two circles as given below. The Universal set is represented by a rectangular shape. For example, let set A contains even numbers and set B contains odd numbers. Union set of both set A and set B contains natural numbers. The following Venn diagram represents the above sets.
The following formula is very useful to solve problems based on two sets.
![]()
Confused between CGPA and Percentage?
Get your results instantly with our calculator!
Set Operations For Two sets
Following are some important set operations
Venn Diagram: Union Of Two Sets
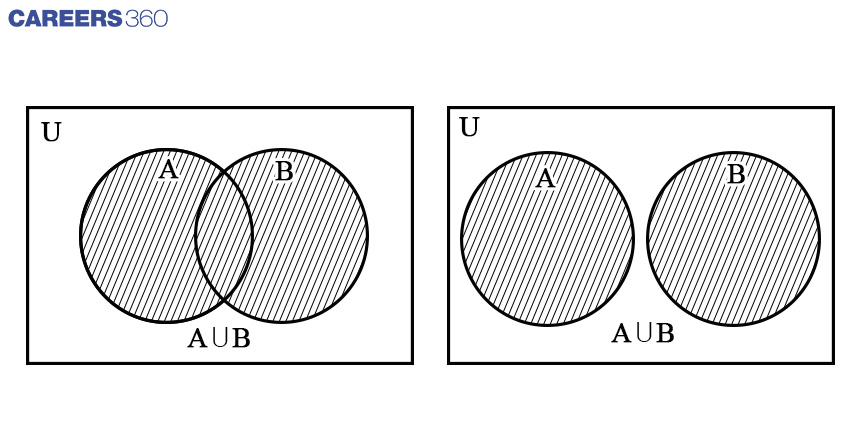
A union set of two sets is defined as a set of elements that contains all the elements contained by both set A and set B.
It is given by
![]()
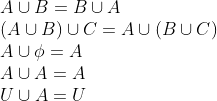
Following are some properties for union operations.
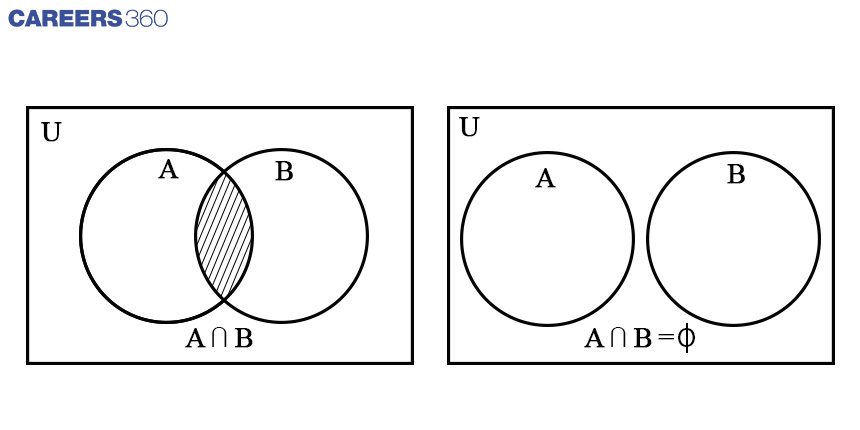
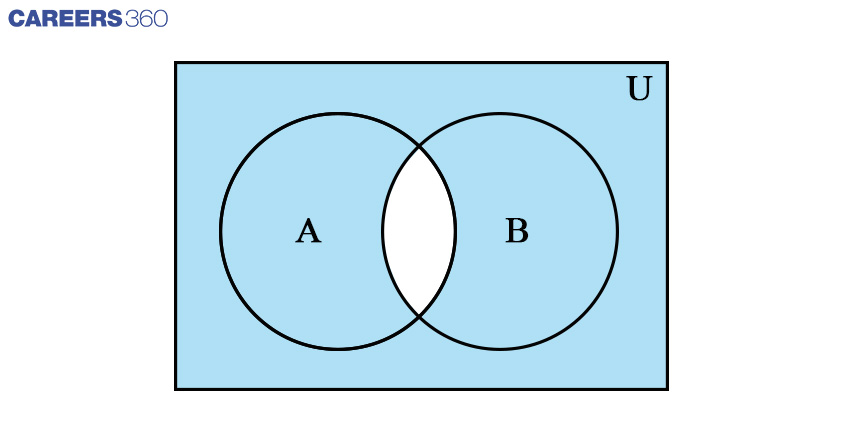
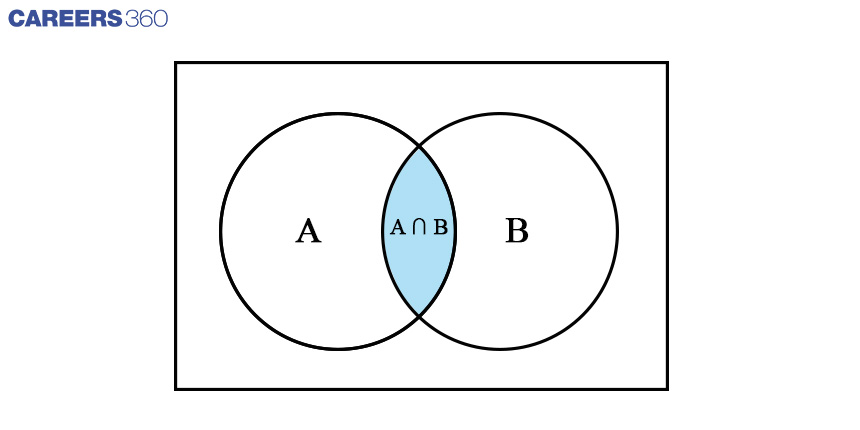
Venn Diagram: Intersection Of Two Set
The intersection of two sets A and B represents the common element between these two sets. It is defined as
![]()
If there is no common element then it is called a disjoint set. The following image represents the intersection and disjoint set.
Following are some properties for intersection operation.
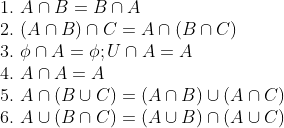
Venn Diagram: Complement Of A Set
The Complement of a set contains all the elements that are not included in the set. It is defined as
![]()
Venn Diagram: Complement Of Union Of Two Set
The complement of a union of two sets is represented as (A∪B)’ which contains all elements that are not included in the union set of A and B. the Venn diagram for it is given below.
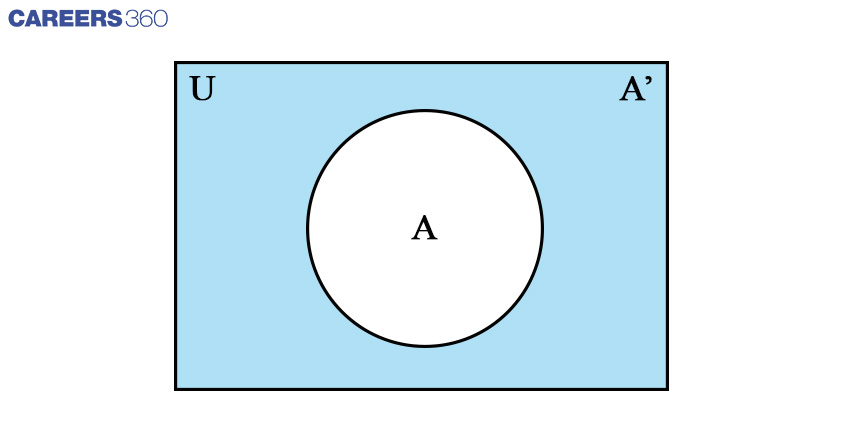
Venn Diagram: Complement of Intersection Of Two Sets
The complement of the Intersection of Two sets is represented as (A∩B)’ that includes all the elements which are not included in the intersection set of A and B. it is shown in the following Venn diagrams.
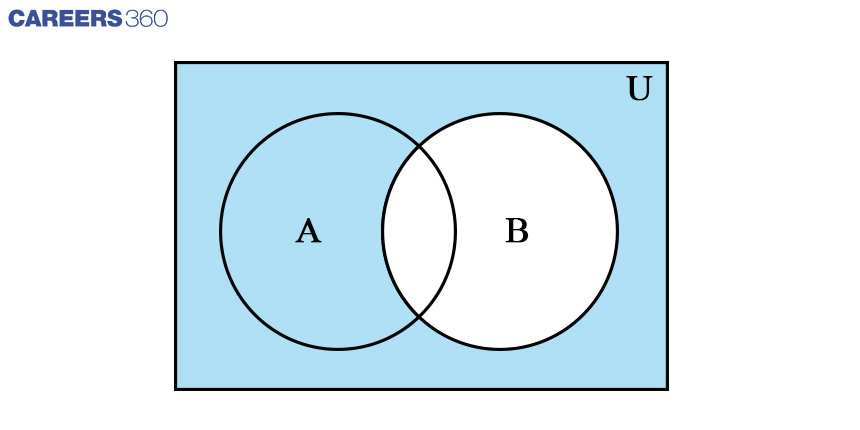
Venn Diagram: Difference Between Two sets
Consider there are two sets A and B. the difference between the two sets is represented by (A-B). This is a set that contains elements that are in set A but not contained in set B. following Venn diagram shows the difference between the two sets.
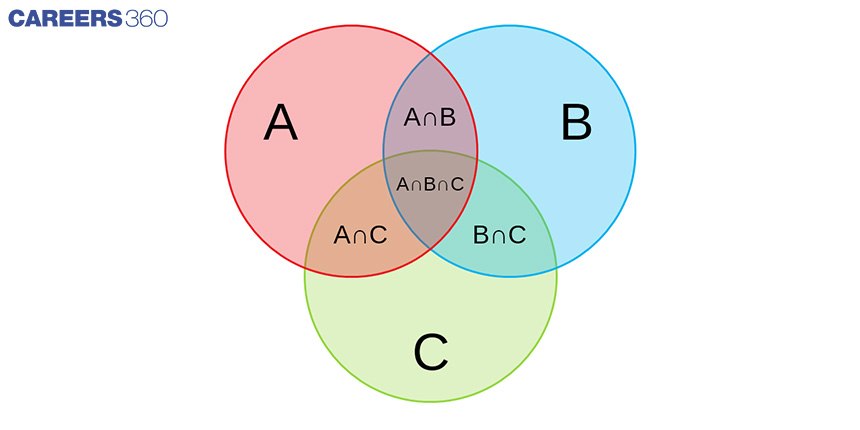
Venn Diagram Of Three Sets
Venn diagram for three sets A, B, and C is given below.
![]()
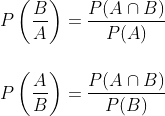
This formula is very useful to solve problems based on the three sets. Also following are Some important formulas from conditional probability that are used with the concepts of Venn diagrams.
Practice Questions
Q-1: If A and B are two events such that P(A) = 1/3, P(B)=1/5, and P(A∪B) = 1/2 then P(A | B’) + P(B | A’) is equal to (JEE Main 2022)
Solution:
![]()
![]()
![]()
![]()
Alternative: Using Venn diagram

We can observe that the shaded area (A∩B) counted two times while doing A∪B
Therefore A∩B can be calculated by
![]()
![]()
![]()
![]()
![]()
![]()
Q-2: Find ![]() if
if ![]() .(CBSE 2020)
.(CBSE 2020)
Solution:
![]()
![]()
![]()
![]()
Alternative: Using the Venn diagram
We can observe that the shaded area(A∩B) counted two times while doing A∪B
Therefore, (A∩B) can be calculated as
![]()
![]()
![]()
Q-3: P(A) = 0.6, P(B) = 0.3, and P(A∩B) = 0.2 Then find P(A/B) (RBSE 2019)
Solution:
Given That
P(A) = 0.6, P(B) = 0.3, and P(A∩B) = 0.2
Find Out: P(A/B)
We can draw a Venn diagram for this question as shown below.

P(A/B) = P(A∩B)P(B) = 0.20.3 = 23
Even though Venn diagrams are a part of Class 11 Maths syllabus, they have multiple applications in different branches of mathematics like set theory, statistics and probability as well these concepts are useful to solve problems based on logic gates in physics and aptitude problems in mathematics.
