

From GDP To Gini Coefficient: Understanding Economic Indicators Through Class 12 Maths
Economic indicators are crucial tools that can provide valuable insights into a wide range of economic factors. Right from the strength of a nation's labour market to the overall level of wealth and income inequality in a society.

One of the most commonly used economic indicators is Gross Domestic Product (GDP), which measures the total value of goods and services produced within the country's borders over a specified period. However, GDP alone does not tell the whole story of our country’s economic well-being. It is just one of many indicators that can be used to provide a more nuanced understanding of economic trends.
Another important economic indicator is the Gini Coefficient, which measures the degree of income inequality within a society. This coefficient ranges from 0 (perfect equality, where everyone has the same income) to 1 (perfect inequality, where one person has all the income and everyone else has none). The Gini Coefficient is a useful tool for policymakers and economists, as it can help identify areas where income inequality is particularly acute, and inform the design of policies to address this issue.
Let us explore some of the key economic indicators used by economists and policymakers, including GDP, the Gini Coefficient, and others. The mathematical principles behind these indicators, and show how they can be used to inform economic policies and promote sustainable growth and development. Whether you are a Class 12 student of economics, or simply interested in understanding how the economy works, this article will provide valuable insights into the power of economic indicators and the role of maths in understanding them.
Also Read | Supply And Demand: A Mathematical Analysis Of Market Equilibrium
Economic Indicators
Here are some of the most commonly used economic indicators:
Gross Domestic Product (GDP)
The GDP, which stands for Gross Domestic Product, is a metric used to quantify the overall value of all goods and services that are produced within the geographic boundaries of a country over a specified period, typically a year. This metric is widely regarded as a critical gauge of a nation's economic performance. In Class 12, students study the various methods of calculating GDP. Here we will discuss the four methods of calculating GDP along with the mathematical calculations.
Expenditure Method
Income Method
Production Method
Value-added Method
1. Expenditure Method
In this method, GDP is calculated by adding up all the expenditures made on the purchase of goods and services within a country during a specific period. The mathematical formula for calculating GDP using the expenditure method is:
GDP = C + I + G + (X-M)
Where:
C = Personal consumption expenditures
I = Gross private domestic investment
G = Government consumption expenditures and gross investment
X = Exports of goods and services
M = Imports of goods and services
To illustrate the calculation of GDP, let's consider the following hypothetical example:
Suppose a country produces the following goods and services in a year:
Personal consumption expenditures (C): ₹500 billion
Gross private domestic investment (I): ₹200 billion
Government consumption expenditures and gross investment (G): ₹300 billion
Exports of goods and services (X): ₹100 billion
Imports of goods and services (M): ₹50 billion
Then, using the formula above, we can calculate the GDP as follows:
GDP = C + I + G + (X - M)
= ₹500 billion + ₹200 billion + ₹300 billion + (₹100 billion - ₹50 billion)
= ₹1,050 billion
Therefore, the GDP of this hypothetical country is ₹1,050 billion. This is a measure of the total economic output of the country over the specified period.
2. Income Method
In this method, GDP is calculated by adding up all the incomes generated by the production of goods and services within a country during a specific period. The mathematical formula for calculating GDP using the income method is:
GDP = W + R + I + P
Where, W = Wages and Salaries,
R = Rent,
I = Interest,
P = Profits
3. Production Method
In this method, GDP is calculated by summing up the value of all goods and services produced within the country's borders during a specific period. This is also known as the output method. The mathematical formula for calculating GDP using the production method is:
GDP = VA + T - S
Where, VA = Value Added,
T = Indirect Taxes,
S = Subsidies
4. Value-added Method
In this method, GDP is calculated by adding up the value added at each stage of production. The mathematical formula for calculating GDP using the value-added method is:
GDP = VA1 + VA2 + VA3 + ... + VAn
Where, VA1, VA2, VA3, ..., VAn are the value added at each stage of production.
Also Read | Unlock The Secrets Of Cryptography With The Help Of Mathematics
Gini Coefficient
The Gini Coefficient is a measure of inequality of a distribution, widely used in economics and social sciences. It is a number between 0 and 1, where 0 represents perfect equality (everyone has the same income or wealth) and 1 represents perfect inequality (one person has all the income or wealth).
The Gini Coefficient can be calculated using the following formula:
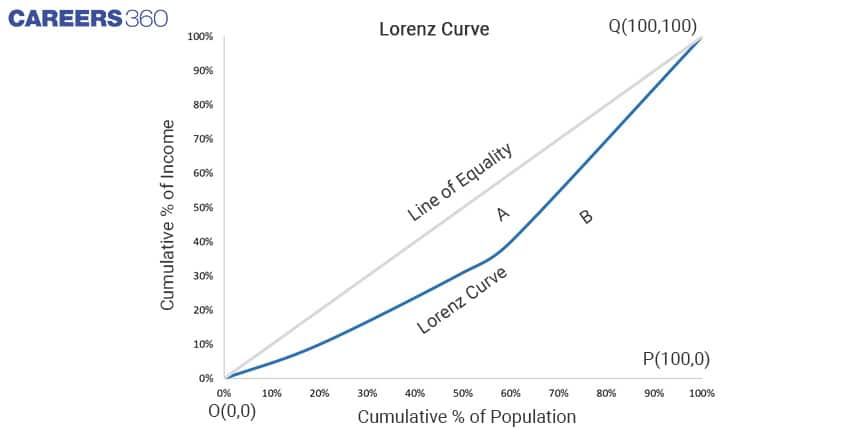
G = (A / (A + B))
Where A is the area between the Lorenz curve and the line of perfect equality (the diagonal line), and B is the area between the Lorenz curve and the horizontal axis (the line of perfect inequality).
The Lorenz curve is a graph that shows the cumulative percentage of a population on the horizontal axis, ranked by income or wealth, and the cumulative percentage of income or wealth they hold on the vertical axis. The Lorenz curve is always below the line of perfect equality and above the line of perfect inequality.
Suppose we have data on the income distribution of a country, and we have calculated the cumulative percentage of the population and the cumulative percentage of income as follows:
Cumulative % of Population | Cumulative % of Income |
10 | 1 |
20 | 3 |
30 | 6 |
40 | 10 |
50 | 15 |
60 | 21 |
70 | 28 |
80 | 37 |
90 | 51 |
100 | 100 |
Lorenz Curve of above data
Also Read | Understanding Inflation: A Class 12 Maths Concept
We can calculate the area using the Trapezoidal Rule which evaluates the area under the curves by dividing the total area into smaller trapezoids rather than using rectangles.
Area of trapezium = ½(sum of parallel lines)(height between parallel lines)
A + B = Area of triangle OPQ
A + B = ½(100)(100) = 5000
Area B is simply the area between the Lorenz curve and the x-axis.
B = ½(1)(10) + ½(3 + 1)(10) + ½(6 + 4)(10) + ½(10 + 6)(10) + ½(15 + 10)(10 + ½(21 + 15)(10 + ½(28 + 21)10 + ½(37 + 28)10 + ½(51 + 37)10 + ½(100 + 51)10
= 5 + 20 + 50 + 80 + 125 + 180 + 245 + 325 + 755
= 1785
To calculate A, we first need to calculate the area between the Lorenz curve and the line of perfect equality.
A = 5000 - 1785 = 3215
Finally, we can calculate the Gini Coefficient:
G = A / (A + B)
G = 3215 / (5000)
G = 0.643
This means that the income distribution in this country is highly unequal, with almost all the income concentrated in the hands of a few individuals.
Economic indicators such as GDP and the Gini Coefficient are vital tools for understanding the performance and health of a country's economy. While GDP measures the total value of goods and services produced within a country's borders over a specified period, the Gini Coefficient measures how this income is distributed within the society. Maths play an important role in determining these vital tools of the economy.
