Distance Time Graph and Velocity Time Graph - Definition, Examples, FAQs
More importantly, for physicists, distance-time and velocity-time graphs are useful illustrations in describing as well as representing visual motion behaviours, through a change of position or speed with time, so that they understand the pattern of movement and have some idea about the future position.
In this article, we will discuss the distance-time graph for uniform motion and the velocity-time graph for uniform motion, covering the uses of these motion graphs, how they represent uniform and non-uniform motion, and the concept of the graphical representation of motion for Class 9 students.
What is a Distance Time Graph?
Distance - time graph represents the distance covered by an object from the starting point against the time. In the graph, time is taken alongside X - the axis and distance is taken alongside Y- the axis.
Uses of Distance-Time Graph
- The graph of distance and time is used to determine the position of an object at any time in the given time interval.
- To determine the speed of an object at any time in the given time interval.

The graph of uniform and non-uniform motion of an object can be studied on the basis of a distance-time graph. Let us now draw a distance-time graph for uniform and non-uniform motion to understand it clearly.
Point to be noted: area under the distance-time graph is nonentity
Equation of distance time graph= Slope = speed = distance/time
Also read -
- NCERT Solutions for All Subjects
- NCERT Notes for all subject
- NCERT Exemplar Solutions for All Subjects
For uniform motion:
Let us study the position-time graph for uniform motion along the straight line. We know, when an object covers the same distances in the same intervals of time it is said to be in uniform motion.
Let’s take an example of a distance-time graph for uniform motion, a school bus is moving in a straight line and covers the following distances in a given time interval.
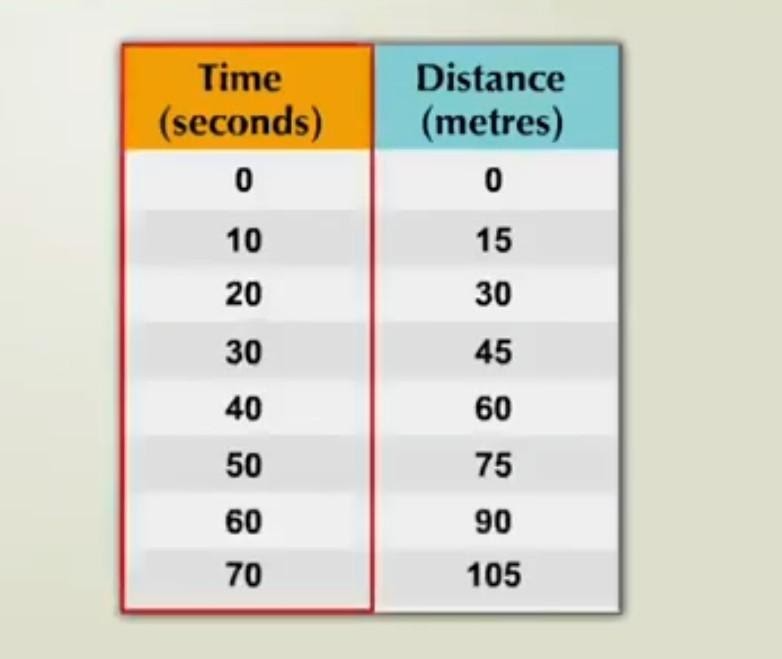
Fig. (i)
In Fig. (i) First column shows time in unit "seconds" and the second column shows distance in unit "meters ". Now let us draw the distance-time graph for uniform motion taking time along X - X-axis and distance along Y - axis.
The X-axis scale of the graph is:
1 centimeter = 10 seconds
The Y-axis scale of the graph is:
1 centimetres = 15 meters
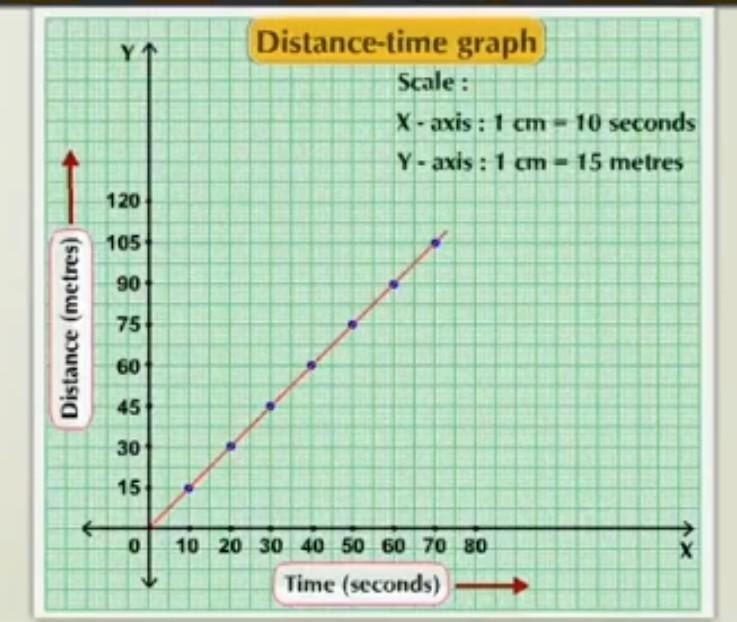
Fig. (ii)
What does the distance-time graph represent?
As the distance-time graph of uniform motion is a straight line, distance and time are directly proportional to each other which means an object covers an equal distance in equal intervals of time in case of uniform motion. The slope of the straight line in the distance-time graph of an object moving with uniform speed gives the speed of the moving object.
For non–uniform motion:
Let us study the distance-time graph for non-uniform motion along the straight line. We know, that when an object covers uneven distances in equivalent intervals of time it is said to be in uniform motion.
Let’s take an example from the distance-time graph, a car is travelling in a straight line in a non–uniform motion with the following distances in a given time interval.
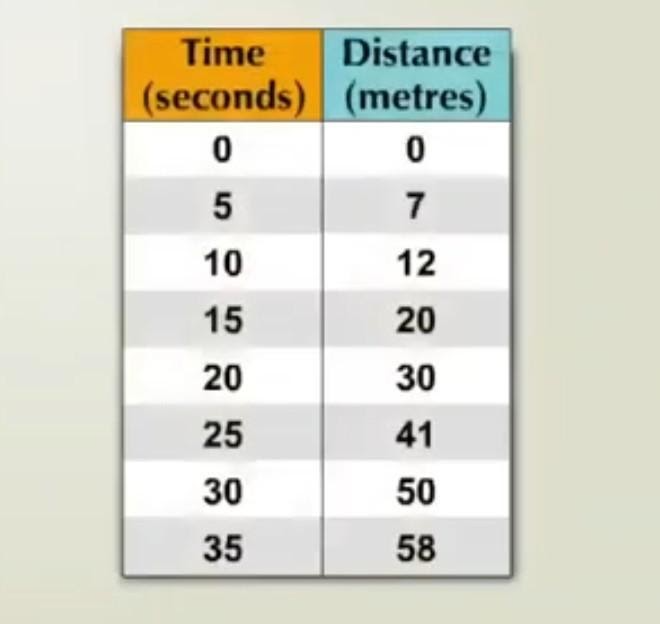
Fig. (iii)
In Fig. (iii) the first column shows time in unit "seconds" and the second column shows the distance in unit "meters ".Now let us draw a position time graph taking time along the X-axis and distance along the Y-axis.
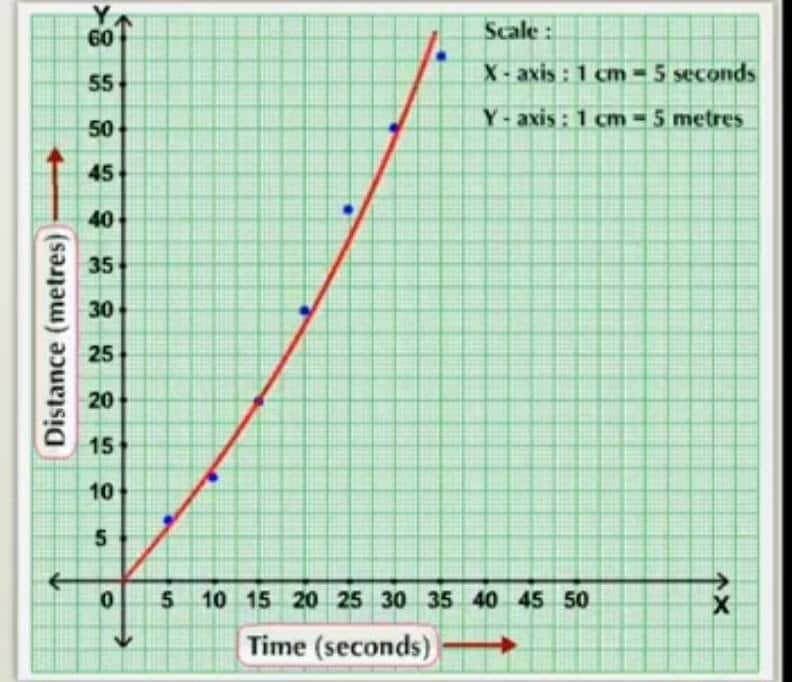
Fig. (iv)
The X-axis scale of the graph is:
1centimeter = 5 seconds
The Y-axis scale of the graph is:
1 centimetres = 5 meters
What does the distance-time graph represent?
As the distance and time graph is not a straight line, we can say that distance is not proportional to time. In other words, in the case of a distance-time graph for non-uniform speed distance does not change uniformly with time.
Related Topics |
Distance time graph for a body at rest:
In the distance-time graph for the body at rest, the graph will show a line parallel to the x-axis. The parallel line shows that the time is changing but the position of the body is the same.
Let us now draw a distance-time graph for an object at rest.
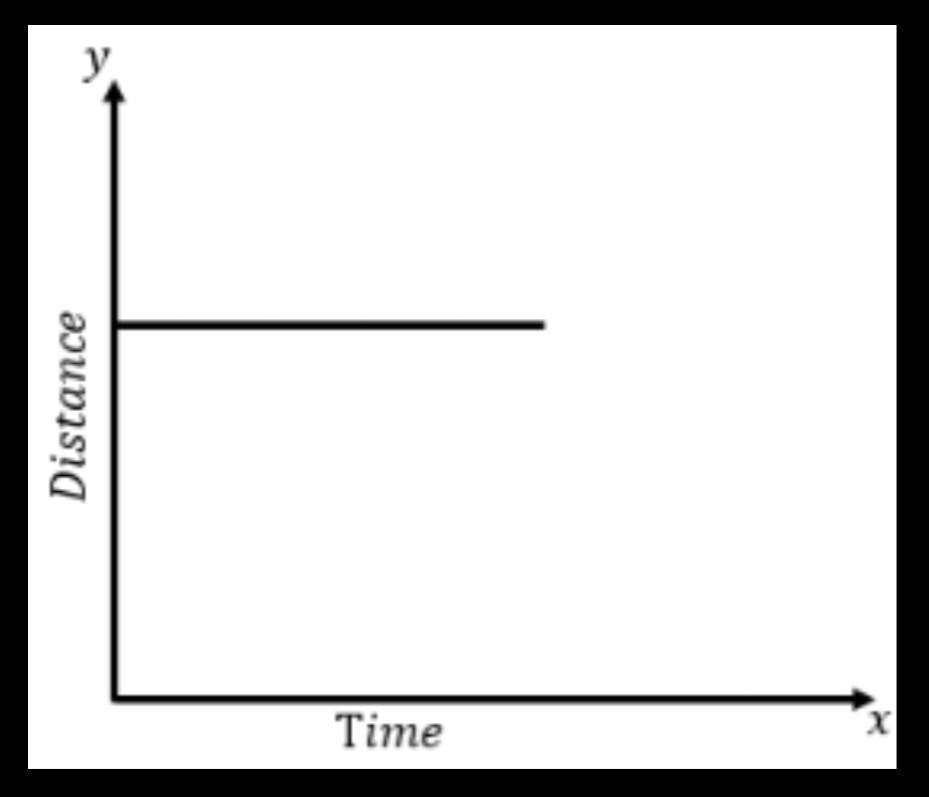
Fig. (v)
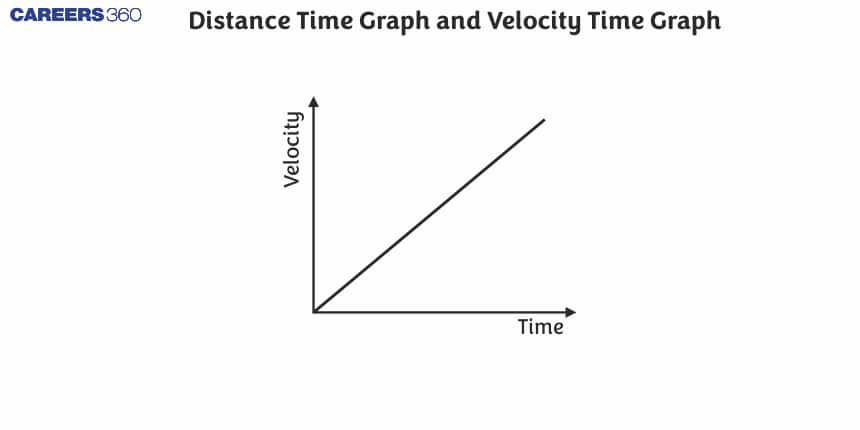
Velocity – Time Graph
The velocity-time graph is a graph in which the Velocity varies with the time for an object moving in a straight line. In this graph, time is taken alongside X-axis and Velocity is taken alongside Y-axis. This graphical representation of motion is another crucial concept in Class 9 physics, allowing students to understand velocity changes during motion.
Uses of v vs t Graph
- To determine the magnitude of the displacement (distance).
- To get the information about the acceleration of an object.
Answer to the question of how to calculate distance from velocity-time graph/ how to find distance from velocity-time graph: The area enclosed by the Velocity time graph gives the magnitude of displacement. The uniform and non - uniform motion of an object can be studied on the basis of the Velocity time graph for class 9.
Velocity time relation =
Slope = acceleration = velocity/time
For uniform velocity:
Let us study the Velocity time graph examples to understand uniform motion along a straight line. We know, that when an object covers the same distances in the same interims of time it is said to be in uniform motion.
Let’s say we have information about a moving car having velocity in unit “meters per second” and time in unit “seconds”. In this graph, time is taken alongside X-axis and Velocity is taken alongside Y- axis.
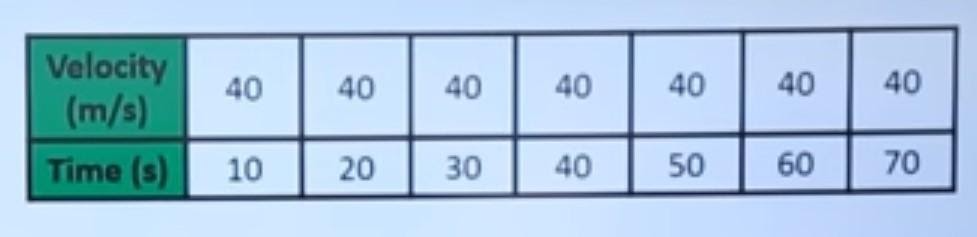
Fig. (v)
Now let us draw a Velocity time graph for uniform motion in order to understand it further.
Following is the Velocity time graph for uniform velocity.
The X-axis scale of the graph is:
1centimeter = 10 seconds
The Y-axis scale of the graph is:
1 centimetre = 10 meters per second.
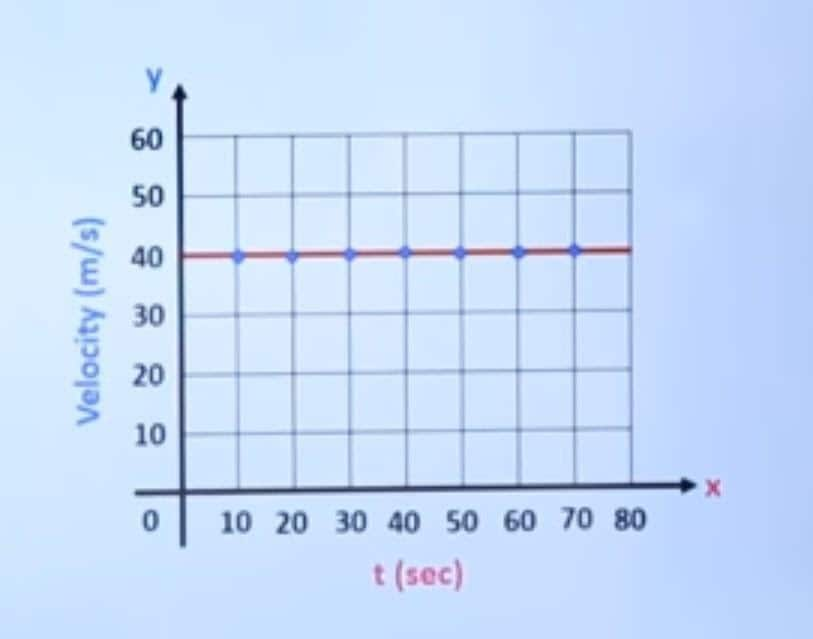
Fig. (vi)
If the object moves in uniform motion, then, the Velocity vs time graph will show a line parallel to the x-axis (i.e. time interval).
What can we understand from this graph?
This is a constant velocity graph. We know that acceleration is defined as the rate of change of velocity but here we do not have any change in the velocity throughout so we can say there is no acceleration. So it is a zero acceleration graph.
So whenever we notice a velocity-time graph parallel to the x-axis we can conclude two things first, the body is moving with uniform velocity and second, the acceleration is zero.
For uniform accelerated motion (increasing):
Let us study the velocity time graph for uniform acceleration motion,
Let’s say we have information about a moving car having velocity in unit “meters per second” and time in unit “seconds”. In this graph, time is taken alongside X - the axis and Velocity is taken alongside Y- the axis.
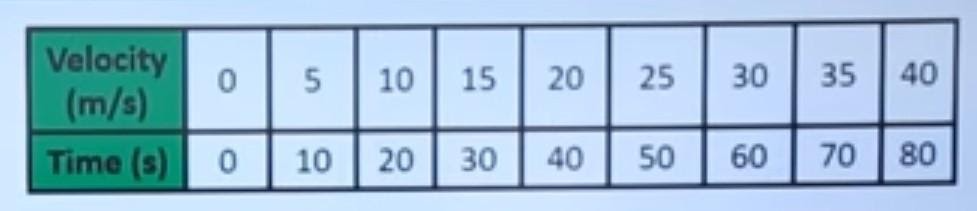
Fig. (vii)
Now let us plot the vt graph for uniform motion in order to understand it further.
Following is a velocity-time graph of uniform motion.
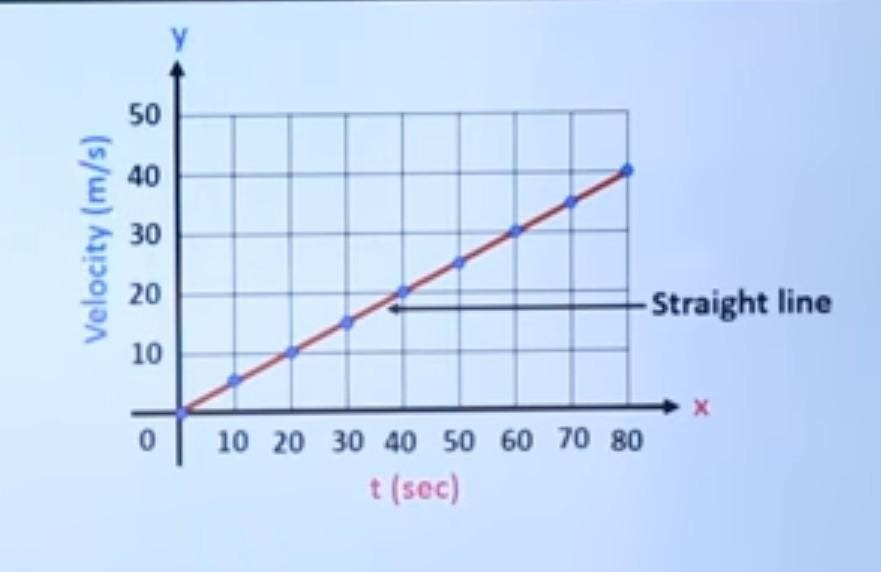
Fig. (viii)
The X-axis scale of the graph is:
1centimeter = 10 seconds
The Y-axis scale of the graph is:
1 centimetre = 5 meters per second.
What does the velocity-time graph represent?
We get an increasing graph or we can say again we get a straight line but this time it is not parallel to the x-axis. It is inclined to the x-axis. In the velocity-time graph of uniform acceleration, we can see the velocity is increasing uniformly with time and we get a positive acceleration graph.
The graph for uniform acceleration or uniform acceleration graph or uniform motion graphs or uniformly accelerated motion graph conclude that the body is moving with uniformly increasing velocity and the acceleration of a particle is increasing linearly. A particle starts from rest its acceleration versus time graph gives the maximum velocity of the particle.
A force-time graph for the motion of a body gives the change in linear momentum of the body.
For uniform accelerated motion (decreasing):
Let us study the velocity time graph for uniformly accelerated motion,
Let’s say we have information about a moving car having velocity in unit “meters per second” and time in unit “seconds”. Let’s draw the velocity-time graph for a car moving with uniform acceleration. In this graph, time is taken alongside X - the axis and Velocity is taken alongside Y- the axis.
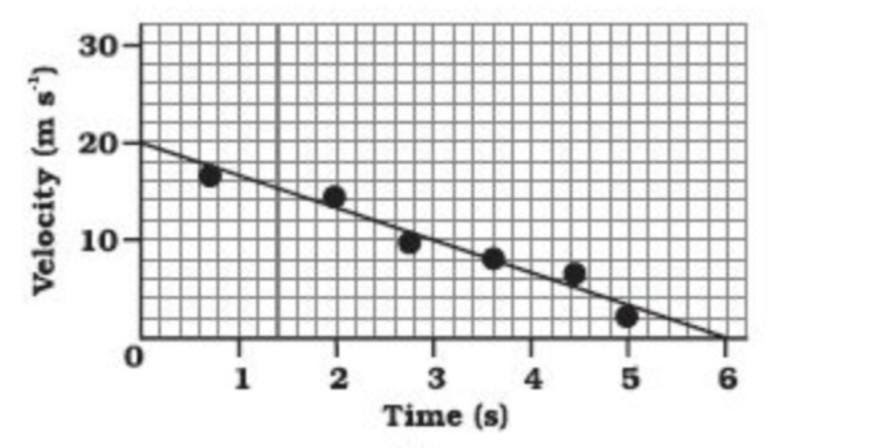
Fig. (ix)
What does the velocity-time graph represent?
Now let us try to infer what this graph is telling us. This velocity-time graph is again a straight line but it has a negative slope. This type of velocity-time graph means that there is a body which is having uniformly decreasing velocity. Hence we have the negative (constant) acceleration or the acceleration is retarding.
For non-uniform accelerated motion:
Let us study the velocity time graph for non-uniform motion.
Say we have information about a moving car having velocity in unit “meter per second” and time in unit “seconds”. Let’s draw a velocity-time graph for non-uniform acceleration. In this graph, time is taken alongside X - the axis and Velocity is taken alongside Y- the axis.
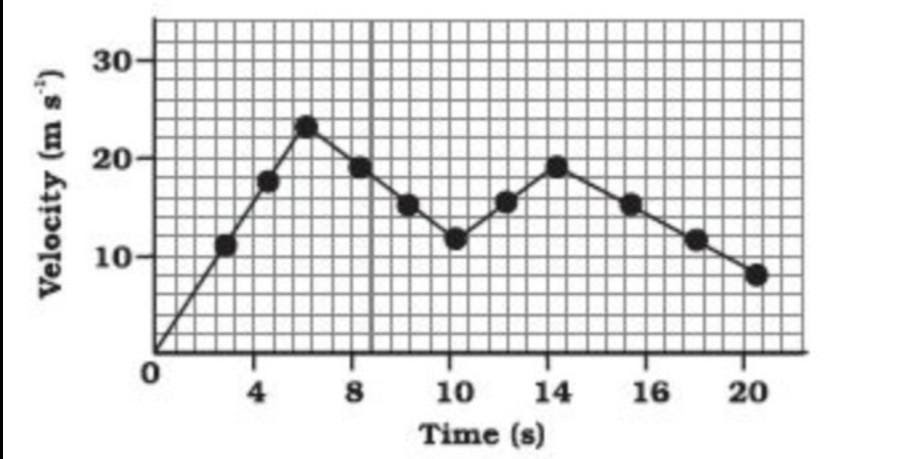
Fig. (x)
By studying these graphs of motion for Class 9, students can grasp fundamental physics concepts related to motion and acceleration. The graphical representation of motion simplifies complex ideas, making them accessible and visually comprehensible.
Frequently Asked Questions (FAQs)
Physical significance of distance time graph- The graph of distance and time is used to determine the position of an object at any time in the given time interval.
Physical significance of velocity time graph - To determine the magnitude of the displacement (distance).
Gradient of distance time is equal to the velocity of an object
Gradient of velocity time graph gives acceleration of an object
Negative gradient means that the slope of the graph is downwards.
Area under distance time graph is nonentity and the area enclosed by the Velocity time graph gives the magnitude of displacement.
Uniform decreasing accelerated motion means that there is a body which is having uniformly decreasing velocity.
Also Read
05 Feb'25 04:57 PM
11 Jan'25 03:00 PM
24 Dec'24 01:28 PM
27 Nov'24 01:02 PM
26 Nov'24 01:31 PM
20 Nov'24 04:50 PM
20 Nov'24 12:59 PM
16 Nov'24 01:06 PM
14 Nov'24 04:17 PM
13 Nov'24 11:06 AM
Articles

Student Community: Where Questions Find Answers